Range Trading
Range trading is a technical strategy designed to profit from market consolidation by buying at established support levels and selling at resistance levels within a defined price corridor.
What is Range Trading?
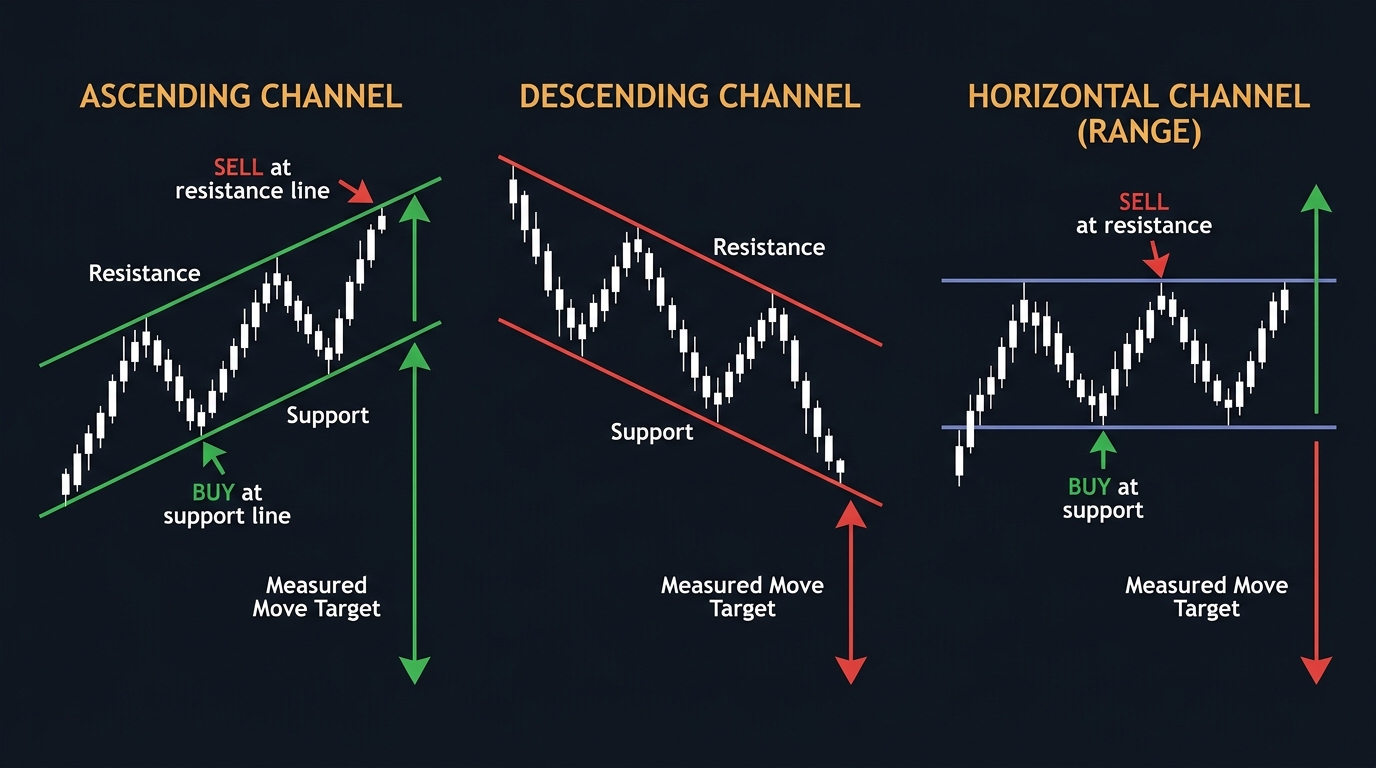
Range trading, also referred to as range-bound trading or channel trading, is an active market strategy that capitalizes on financial assets oscillating between well-defined, horizontal price boundaries.
Instead of searching for prolonged directional trends, a range trader identifies an established equilibrium where buyers consistently enter the market at a lower boundary (Support) and sellers consistently enter at an upper boundary (Resistance).
Extensive quantitative market studies reveal that financial markets, particularly foreign exchange currency pairs, spend approximately 70% to 80% of their trading time consolidating within ranges, rather than moving in sustained directional trends. Range trading provides a structured methodology to extract profits from these non-trending, consolidating market regimes.
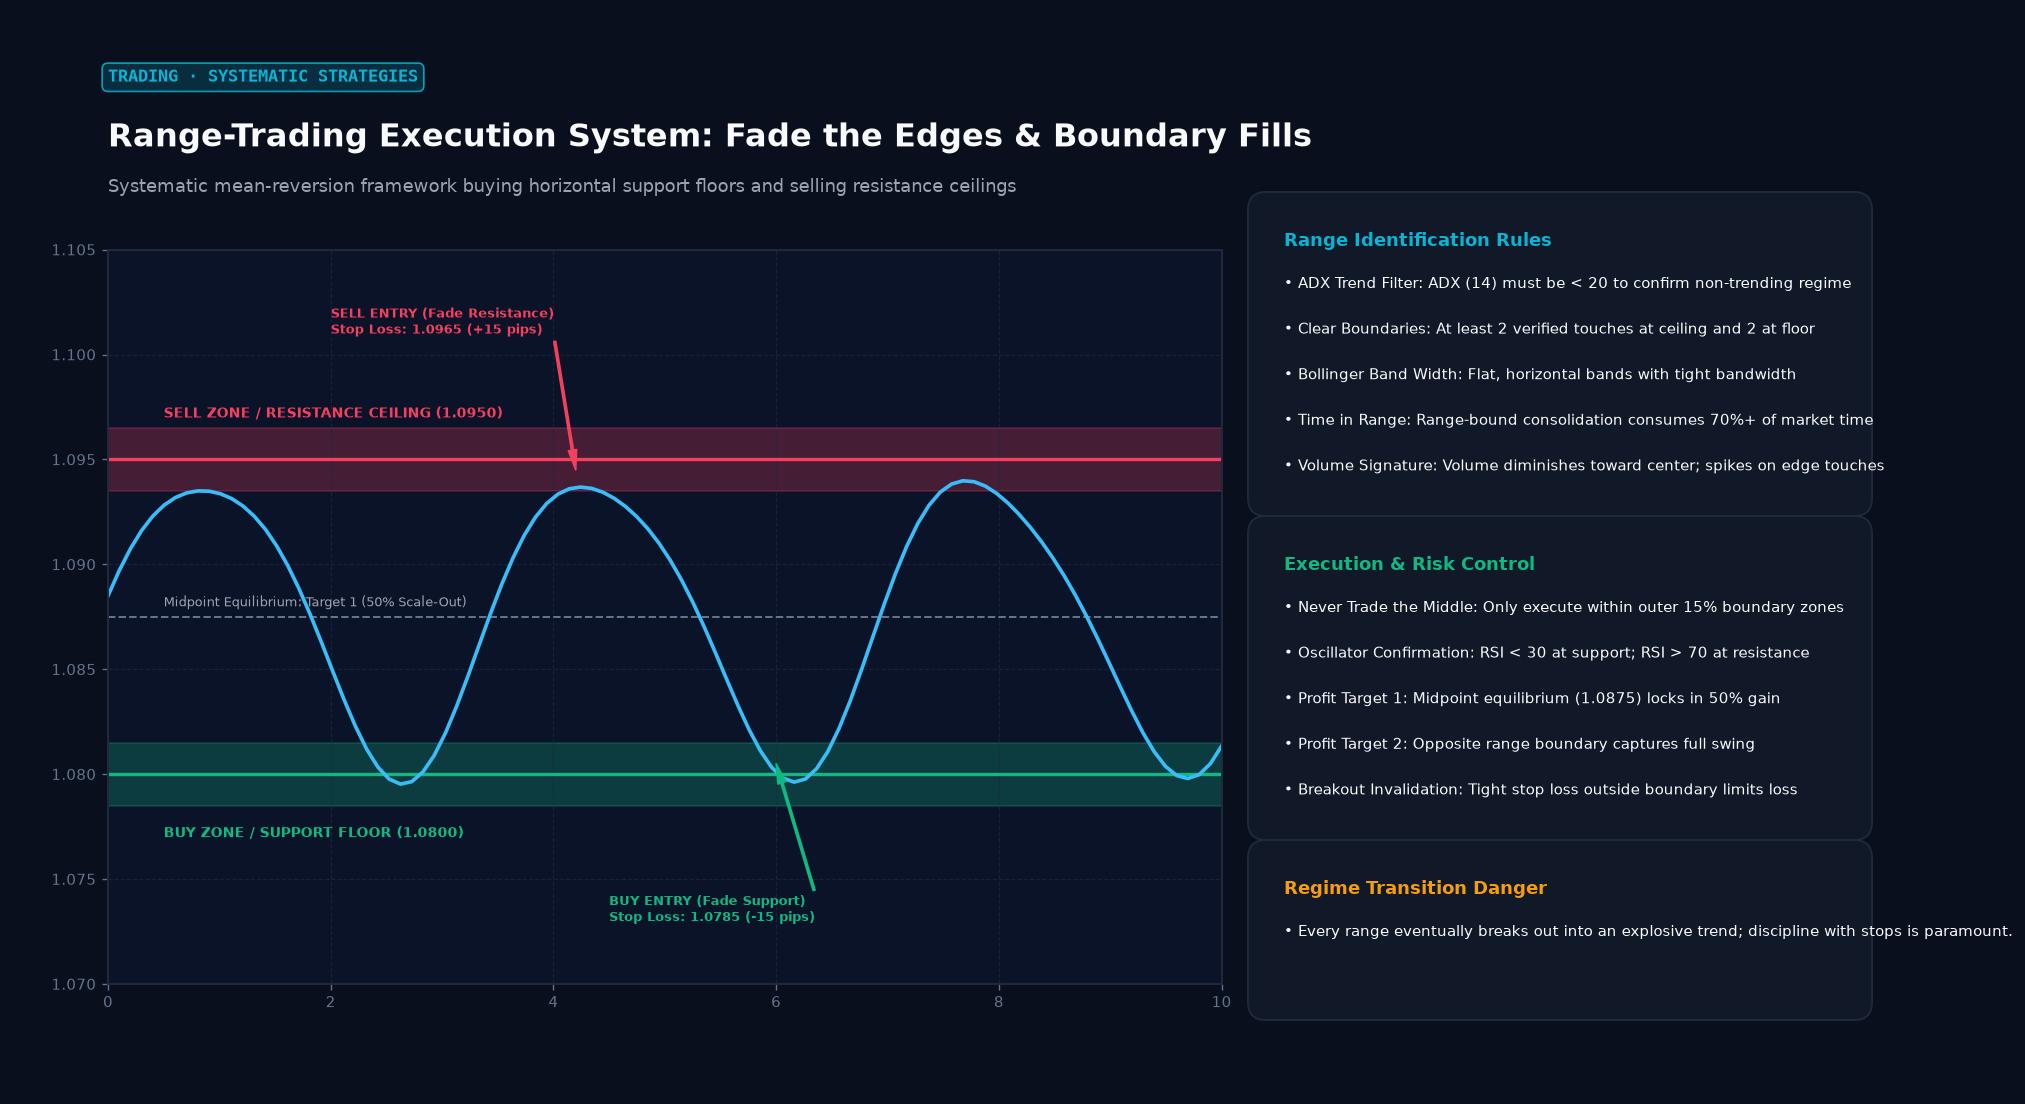 Figure: Systematic mean-reversion framework buying horizontal support floors and selling resistance ceilings
Technical Anatomy of a Trading Range
A trading range emerges when buying power and selling pressure reach dynamic balance. Neither bulls nor bears possess the institutional order flow required to drive prices to new highs or lower lows.
       Resistance (Ceiling) ───[ Peak 1 ]─────────[ Peak 2 ]─────────[ Peak 3 ]───
                                   │ \               / │ \               / │
                                   │  \             /  │  \             /  │
                                   │   \           /   │   \           /   │
       Equilibrium Midpoint ───────│────\─────────/────│────\─────────/────│───
                                   │     \       /     │     \       /     │
                                   │      \     /      │      \     /      │
                                   │       \   /       │       \   /       │
       Support (Floor) ────────────┴─────[ Trough 1 ]──┴─────[ Trough 2 ]──┴─────
The Rule of Touches
For a valid trading range to be recognized by institutional algorithms, the price corridor must demonstrate clear structural touches:
- Initial Boundary Formation: The asset establishes a distinct high (Peak 1) followed by a sharp reaction low (Trough 1).
- Confirmation Touches: The price rallies back toward the previous high and reverses lower (Peak 2), followed by another bounce from the prior low (Trough 2).
- The Established Channel: Once at least two reaction highs and two reaction lows confirm the horizontal corridor, a formal trading range exists. Subsequent tests of these levels offer statistical trade opportunities.
Tactical Execution: Entry, Exit, and Oscillators
Trading within a confirmed range requires discipline. Entering trades in the center of the range yields poor risk-to-reward ratios; entries must be executed close to the outer boundaries.
+------------------------------------------------------------------------------------+
|                         RANGE TRADING EXECUTION MATRIX                             |
+-------------------+----------------------------------------------------------------+
| OPERATIONAL STEP  | EXECUTION ACTION & CRITERIA                                    |
+-------------------+----------------------------------------------------------------+
| Long Entry        | Price touches or pierces Support floor; confirmation via       |
| (Buy Signal)      | oversold oscillator reading (RSI < 30, Stochastic %K/%D cross).|
+-------------------+----------------------------------------------------------------+
| Short Entry       | Price touches or pierces Resistance ceiling; confirmation via   |
| (Sell Signal)     | overbought oscillator reading (RSI > 70, Stochastic cross).    |
+-------------------+----------------------------------------------------------------+
| Primary Target    | Opposite boundary of the range (Full target), or the range      |
| (Take-Profit)     | midpoint / 20-period moving average (Partial target).          |
+-------------------+----------------------------------------------------------------+
| Stop-Loss Order   | Placed strictly beyond the support/resistance level, buffered   |
| (Risk Control)    | by 1.0 to 1.5 times the Average True Range (ATR).              |
+-------------------+----------------------------------------------------------------+
1. Fading Support and Resistance
The primary tactic in range trading is fading the boundaries:
- Long Trade: When price declines into the support zone, the trader enters a long position, anticipating that buyers will defend the level.
- Short Trade: When price rallies into the resistance zone, the trader opens a short position, anticipating that supply will overwhelm buyers.
Price Approaches Resistance ($1.1000)
                 │
                 ▼
RSI Rises to 72 (Overbought) + Bearish Rejection Candlestick Formed
                 │
                 ▼
EXECUTE SHORT ENTRY at $1.0990
                 │
                 ├─► Stop-Loss Placed at $1.1030 (Above Resistance + ATR Buffer)
                 ├─► Target 1: Range Midpoint ($1.0925)
                 └─► Target 2: Range Support Floor ($1.0850)
2. Oscillator Confirmation (RSI and Stochastics)
Because price often hovers around support or resistance without reversing immediately, professional traders use momentum oscillators to time execution:
- Relative Strength Index (RSI): A long entry is signaled when the 14-period RSI drops below 30 (oversold) and turns back above 30 while testing the support floor. Bullish momentum divergence (where price makes an equal low while RSI makes a higher low) provides confirmation.
- Stochastic Oscillator: A crossover of the fast %K line above the slow %D line while below the 20 benchmark indicates that downward momentum has stalled, providing a timing trigger for long execution.
Range-Bound Indicators: Volume Profile and Bollinger Bands
In addition to traditional trendlines, quantitative traders employ statistical tools to map consolidation corridors:
+------------------------------------------------------------------------------------+
|                         RANGE ANALYSIS INDICATOR SUITE                             |
+-------------------+----------------------------------------------------------------+
| INDICATOR         | ANALYTICAL FUNCTION IN CONSOLIDATION                           |
+-------------------+----------------------------------------------------------------+
| Volume Profile    | Identifies Value Area High (VAH), Value Area Low (VAL), and    |
| (Auction Theory)  | the Point of Control (POC). Range trades focus on fading       |
|                   | deviations back toward the high-volume POC.                    |
+-------------------+----------------------------------------------------------------+
| Bollinger Bands   | Identifies range contraction ("Bollinger Squeeze"). When bands |
|                   | flatten horizontally, the upper and lower 2-standard-deviation |
|                   | bands serve as dynamic support and resistance boundaries.      |
+-------------------+----------------------------------------------------------------+
| Average True      | Measures volatility to establish protective stop buffers       |
| Range (ATR)       | outside the channel, insulating traders from noise sweeps.     |
+-------------------+----------------------------------------------------------------+
Volume Profile and Auction Market Theory
Under Auction Market Theory, an established range represents a high-volume consolidation zone where market participants agree on fair value.
- The Point of Control (POC) represents the single price level where the highest volume was transacted.
- The Value Area (VA) encompasses the price range where 70% of total volume occurred, bounded by the Value Area High (VAH) and Value Area Low (VAL).
- In range trading, when price extends outside the Value Area into low-volume territory (e.g., piercing above VAH) and fails to find acceptance, algorithmic traders sell the excess, targeting a return to the POC.
Managing the Core Risk: False Breakouts vs. True Breakouts
The single largest threat to a range-trading strategy is a true structural breakout, where institutional fundamental order flow permanently shatters the range boundary and launches an aggressive trend.
If a range trader trades without an automatic stop-loss, a breakout can cause severe portfolio drawdowns.
       Range Resistance Ceiling ($100.00)
       ───────────────────────────────────▲──────────────────────────────────────
                                         / \
                                        /   \  Wyckoff "Upthrust" (Liquidity Sweep)
                                       /     \ Price quickly falls back into range
                                      /       ▼
       ──────────────────────────────/───────────────────────────────────────────

       VS.

       TRUE STRUCTURAL BREAKOUT
                                                    ▲  Sustained Bullish Expansion
                                                   /   Heavy Institutional Volume
                                                  /
       Range Resistance Ceiling ($100.00)        /
       ─────────────────────────────────────────/────────────────────────────────
The Wyckoff Spring and Upthrust (Liquidity Sweeps)
Not every breach of a boundary is a true breakout. In fact, institutional algorithms frequently engineer liquidity sweeps (known in classical technical analysis as Wyckoff Springs at support, or Upthrusts at resistance):
- The price briefly pierces support or resistance by 10 to 30 pips.
- This move triggers retail breakout traders’ buy-stop orders and sweeps the protective stop-losses of existing short sellers.
- Once liquidity is captured, large market participants absorb the flow and drive the price back inside the range.
- Experienced range traders capitalize on this dynamic: instead of buying a breakout, they wait for the price to re-enter the range and trade the reversal back toward the opposite boundary.
Setting Protective Stop-Loss Buffers
To prevent being prematurely stopped out by liquidity sweeps while protecting against genuine breakouts, stop-losses should not be placed directly on the support or resistance line.
Instead, professional traders apply a volatility buffer derived from the Average True Range (ATR):
$$\text{Short Stop-Loss Price} = \text{Resistance Level} + (1.0 \text{ to } 1.5 \times \text{ATR})$$
$$\text{Long Stop-Loss Price} = \text{Support Level} - (1.0 \text{ to } 1.5 \times \text{ATR})$$
Asset Selection: Ideal Markets for Range Trading
Range trading is effective in specific assets and market sessions that display low directional drift:
+------------------------------------------------------------------------------------+
|                         OPTIMAL RANGE TRADING ENVIRONMENTS                         |
+---------------------+-------------------------------+------------------------------+
| ASSET CLASS         | SPECIFIC EXAMPLES             | STRUCTURAL RATIONALE         |
+---------------------+-------------------------------+------------------------------+
| Cross-Currency      | EUR/GBP, AUD/NZD,             | Strong economic ties between |
| FX Pairs            | EUR/CHF                       | economies create natural mean|
|                     |                               | reversion and low macro drift|
+---------------------+-------------------------------+------------------------------+
| Low-Volatility      | Asian Session                 | Absence of major US/European |
| Market Sessions     | (00:00 to 07:00 GMT)          | macroeconomic data releases  |
|                     |                               | produces consolidation ranges|
+---------------------+-------------------------------+------------------------------+
| Commodities         | Agricultural Futures          | Bounded by production costs  |
| (Off-Season)        | (Corn, Soybeans, Wheat)       | at the bottom and storage /  |
|                     |                               | substitution costs at top    |
+---------------------+-------------------------------+------------------------------+
Key Takeaways
- Consolidation Exploitation: Range trading targets horizontal price channels where an asset fluctuates predictably between a support floor and a resistance ceiling.
- Prevalence in Markets: Financial markets spend approximately 70% to 80% of their operational time in non-trending consolidation, making range trading a foundational strategy.
- Boundary Confirmation: A valid trading range requires at least two confirmed reaction highs and two confirmed reaction lows before entries can be justified.
- Oscillator Synchronization: Range traders use momentum oscillators (RSI, Stochastics) to identify overbought conditions at resistance and oversold conditions at support.
- Breakout Management: The primary risk is a trending breakout; traders protect capital using pre-set stop-losses buffered by 1.0 to 1.5 times the Average True Range (ATR).
- Optimal Instruments: Highly correlated currency cross-pairs (such as EUR/GBP or AUD/NZD) and low-volatility trading sessions provide favorable conditions for mean-reverting range strategies.
Frequently Asked Questions (FAQ)
What is the difference between a breakout trading strategy and a range trading strategy?
A range trading strategy assumes that an asset’s price will remain within its established support and resistance boundaries, aiming to profit from mean-reversion by buying at support and selling at resistance. In contrast, a breakout trading strategy assumes that when an asset pierces a major support or resistance level with strong volume, consolidation has ended and a new, powerful trend has begun. Breakout traders buy as the price crosses above resistance or sell short as it falls below support, attempting to ride momentum into expansion territory.
How do I identify when a trading range is about to fail and break out?
Several technical warning signs indicate an imminent breakout from a range:
- Ascending Lows or Descending Highs: If price makes higher lows inside the range, pressing relentlessly against resistance without falling back to support, buying pressure is building toward an upward breakout.
- Bandwidth Expansion: If Bollinger Bands squeeze tightly and begin opening outward alongside a surge in tick volume, a volatility expansion is starting.
- Macroeconomic Catalysts: Scheduled high-impact economic news releases (such as central bank interest rate decisions, CPI inflation releases, or Nonfarm Payrolls) inject institutional order flow that frequently shatters consolidation ranges.
Where should I place my take-profit order when trading a range?
A conservative range trader places their primary take-profit order just ahead of the opposite boundary (e.g., a few pips below the resistance ceiling for a long trade, or a few pips above support for a short trade) to ensure execution before counter-trend orders trigger. Many professional traders also operate a two-stage profit strategy: closing 50% of the position at the range midpoint (or Volume Point of Control) to lock in gains and moving the stop-loss on the remainder to breakeven, while allowing the remaining half to run toward the opposite range boundary.
Ready to trade forex?
Open a free demo account with a regulated broker. Practice with virtual funds before risking real money.