Spike
An abrupt, intense, and disproportionately large upward or downward price movement occurring over an extremely brief time interval, typically driven by unexpected macroeconomic announcements, geopolitical shocks, or sudden order-book liquidity vacuums.
What Is a Price Spike?
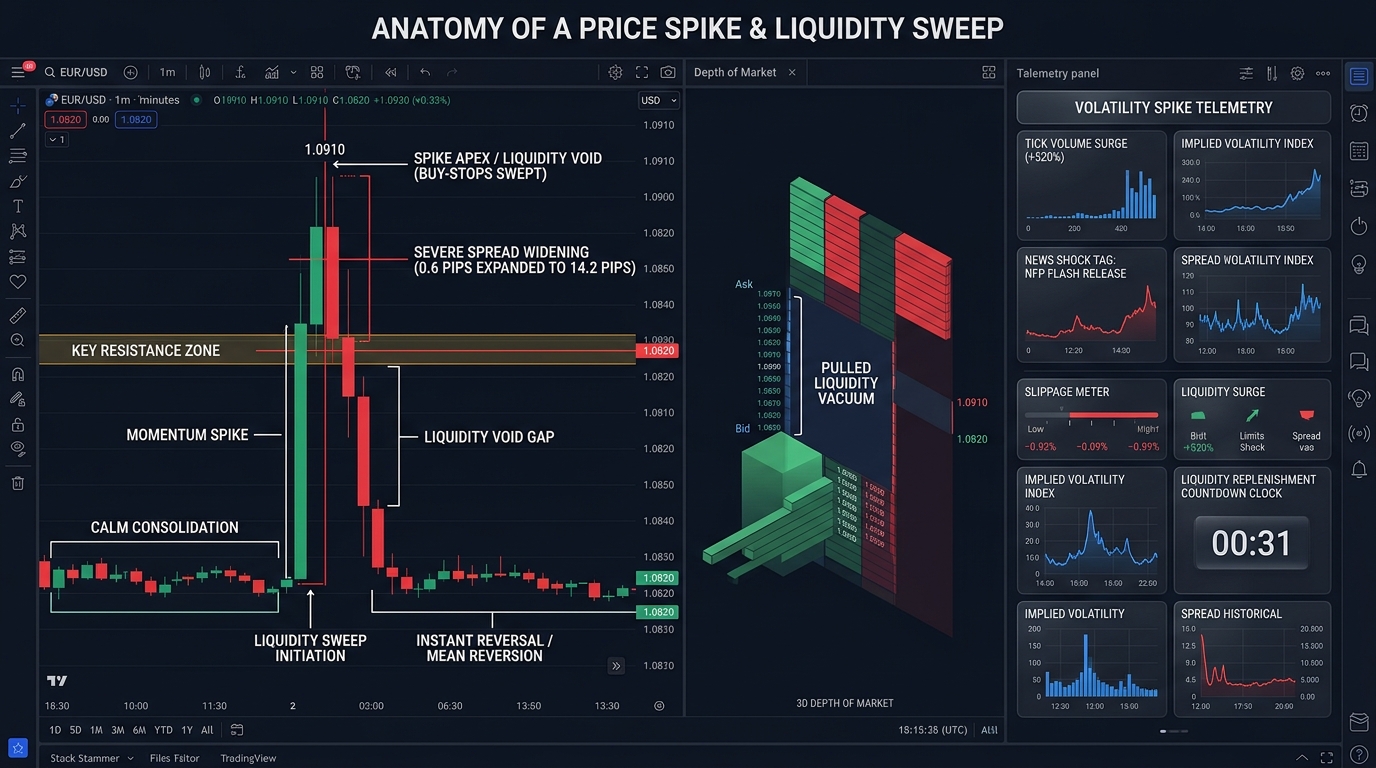
In financial market technical analysis, a spike describes an unusually violent, vertical price excursion that unfolds within seconds or minutes on a price chart. Characterized by an instantaneous surge in price velocity followed frequently by an equally rapid retracement, a spike creates a distinctive visual signature: an elongated candlestick wick (or “pin bar”) accompanied by an isolated bar of extreme range.
Spikes represent temporary breakdowns in two-way market equilibrium. When market makers withdraw their resting limit orders from the central limit order book ahead of major news announcements or during off-peak hours, the market enters a liquidity void. Under these conditions, an influx of aggressive market orders sweeps through multiple price tiers instantly, catapulting the quoted price far beyond its standard statistical distribution.
Primary Catalysts Driving Financial Spikes
Market spikes rarely occur randomly; they are precipitated by three distinct structural phenomena:
1. Macroeconomic and Geopolitical Data Shocks
Scheduled data releases—such as the U.S. Non-Farm Payrolls (NFP), Consumer Price Index (CPI), or unexpected emergency interest rate hikes by central banks—deliver sudden fundamental revaluations. Because automated algorithms process text headlines within milliseconds, buy or sell orders flood into the market simultaneously before human traders can react.
2. Algorithmic Liquidity Sweeps (“Stop Hunts”)
Large institutional market participants (such as bank proprietary desks or hedge funds) require vast amounts of liquidity to execute large block orders without moving the market against themselves. Knowing that retail traders cluster stop-loss orders just beyond key support or resistance levels, algorithms aggressively drive prices into these clusters, triggering a spike that generates the counterparty volume needed to fill institutional orders.
3. “Fat-Finger” Clerical Errors and Spoofing
Human error—such as an institutional trader erroneously entering a market order for $1,000,000,000 instead of $1,000,000—can temporarily overwhelm an electronic matching engine, creating a vertical price spike that collapses the moment automated circuit breakers or compliance filters intervene.
Price Spike vs. Genuine Breakout vs. Whipsaw
| Parameter | Price Spike | Genuine Breakout | Whipsaw |
|---|---|---|---|
| Duration | Seconds to several minutes | Sustained over hours, days, or weeks | Multiple back-to-back erratic swings |
| Retracement Speed | Immediate (Usually retraces 80% to 100% within the same session) | Minimal; price consolidates above the broken level | Moderate; alternating reversals |
| Volume Profile | Massive, isolated 1-minute spike; evaporates immediately | High, sustained volume confirming trend continuation | Inconsistent, choppy volume churn |
| Candlestick Pattern | Pin bar / Long shooting star or hammer wick | Solid, wide-bodied Marubozu closing beyond support/resistance | Alternating bullish and bearish engulfing candles |
Quantitative Measurement: Identifying Outlier Spikes
Quantitative trading systems define spikes statistically by measuring the deviation of price relative to historical volatility benchmarks:
1. Standard Deviation Z-Score
A spike is flagged when the price deviation from the rolling mean ($\mu$) exceeds a critical statistical threshold (typically $Z \ge 3.0$):
$$Z = \frac{P_t - \mu_{20}}{\sigma_{20}}$$
Where $\mu_{20}$ is the 20-period moving average and $\sigma_{20}$ is the standard deviation. A $Z$-score of 3.0 represents a move outside 99.7% of expected price outcomes.
2. Average True Range (ATR) Multiple
If the range of a single candlestick exceeds three to four times the prevailing 14-period Average True Range:
$$\text{Spike Condition} = \text{Range}t \ge 3.5 \times \text{ATR}{14}$$
Real-World Institutional Case Study: The May 2010 Dow Jones “Flash Crash”
The most famous market spike in electronic trading history occurred on May 6, 2010, when the Dow Jones Industrial Average (DJIA) experienced an unprecedented intraday collapse:
       DOW JONES INDUSTRIAL AVERAGE - MAY 6, 2010

 10,600 ──┐ (14:30 EST - Baseline Trading)
          │\
 10,200 ──┼─\
          │  \
  9,800 ──┼───\___ Algorithmic Liquidity Evaporation
          │       \
  9,400 ──┼────────\___ FLASH CRASH BOTTOM: Plunges 998.5 Points (-9.2%)
          │            /
  9,800 ──┼───────────/   Rapid Retracement: Snaps back 600 points in 20 min
          │          /
 10,400 ──┼─────────/
└─────────────────────────────────────────────────────────────- The Trigger: A large mutual fund initiated an automated sell program of 75,000 E-mini S&P 500 contracts ($4.1 billion notional) using an algorithm keyed only to volume without price limits.
- The Spike Vacuum: High-frequency market-making algorithms detected the massive imbalance and instantly withdrew their bids. The absence of liquidity caused prices to plunge through empty books in minutes.
- The Rebound: As value-oriented quantitative models recognized that corporate fundamentals had not changed, massive buying programs stepped in, retracing the vast majority of the 1,000-point spike before the market closed.
- Regulatory Reform: This historic spike led global exchanges to implement mandatory Limit-Up/Limit-Down (LULD) circuit breakers to halt trading when prices spike beyond predetermined volatility bands.
Tactical Rules: How Traders Protect Themselves from Spikes
Experienced traders deploy specific protocols to avoid being liquidated by sudden market spikes:
- Step Aside During Tier-1 News: Refrain from executing new orders 5 minutes before and after high-impact announcements (e.g., US Non-Farm Payrolls or CPI). Spreads widen dramatically, and spikes can trigger stop-losses via severe slippage.
- Never Place Stops at Exact Psychological Levels: Because spikes frequently hunt obvious round numbers (e.g., EUR/USD 1.1000 or Gold $2,500), position stop-loss orders beyond a dynamic volatility buffer (e.g., $1.5 \times \text{ATR}$).
- Wait for Candle Closes: When trading breakouts, never enter on an intraday spike piercing a level. Wait for the hourly or 4-hour candlestick to close beyond the structural boundary to confirm genuine institutional commitment rather than an ephemeral spike.
Frequently Asked Questions
What should a trader do if a sudden spike causes massive execution slippage?
If a price spike triggers an order with severe slippage due to an official exchange erroneous tick (“bad tick”), traders should immediately contact their broker’s trade desk and submit a formal trade dispute. In regulated environments, brokers will review the interbank liquidity log; if the price spike did not reflect genuine executable interbank liquidity, the trade will be price-adjusted or cancelled.
What is the structural difference between a price spike and a price gap?
A gap occurs when an asset opens at a price noticeably higher or lower than its prior close with zero trading activity occurring in between (common over weekends or earnings announcements). A spike involves continuous, rapid execution through all intermediate price increments, creating an unbroken vertical bar or candlestick wick.
Can price spikes be traded profitably?
Yes. Professional mean-reversion traders and statistical arbitrageurs actively fade spikes. When an extreme outlier spike occurs without any underlying fundamental justification, traders execute counter-trend orders targeting the rapid snap-back toward the pre-spike consolidation baseline.
Ready to trade forex?
Open a free demo account with a regulated broker. Practice with virtual funds before risking real money.