Moving Average (MA)
A moving average smooths price data by calculating the average closing price over a specified number of periods, updating with each new bar. It filters out short-term noise to reveal the underlying trend direction. The two main types — simple (SMA) and exponential (EMA) — differ in how they weight recent vs. older data.
The Logic Behind Moving Averages
Moving averages are one of the oldest tools in technical analysis, predating computerized charts by decades. The concept is intuitive: instead of reacting to every price tick, calculate where price has been on average over a defined lookback window. That average line is less reactive to individual candles and reveals the underlying trajectory more clearly.
Every closing price that enters the calculation period “matters.” The debate between traders is over exactly how much weight each past price should carry — which is where the split between simple and exponential moving averages originates.
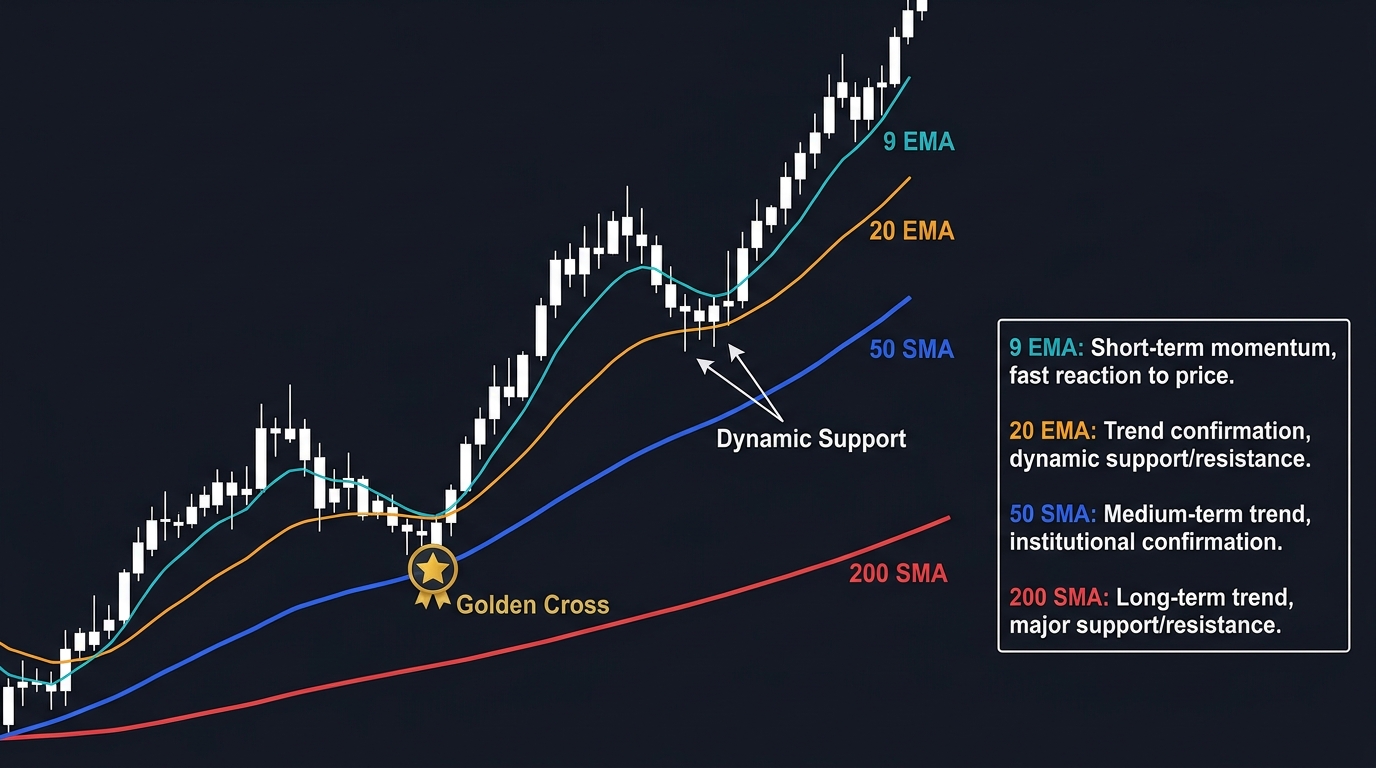
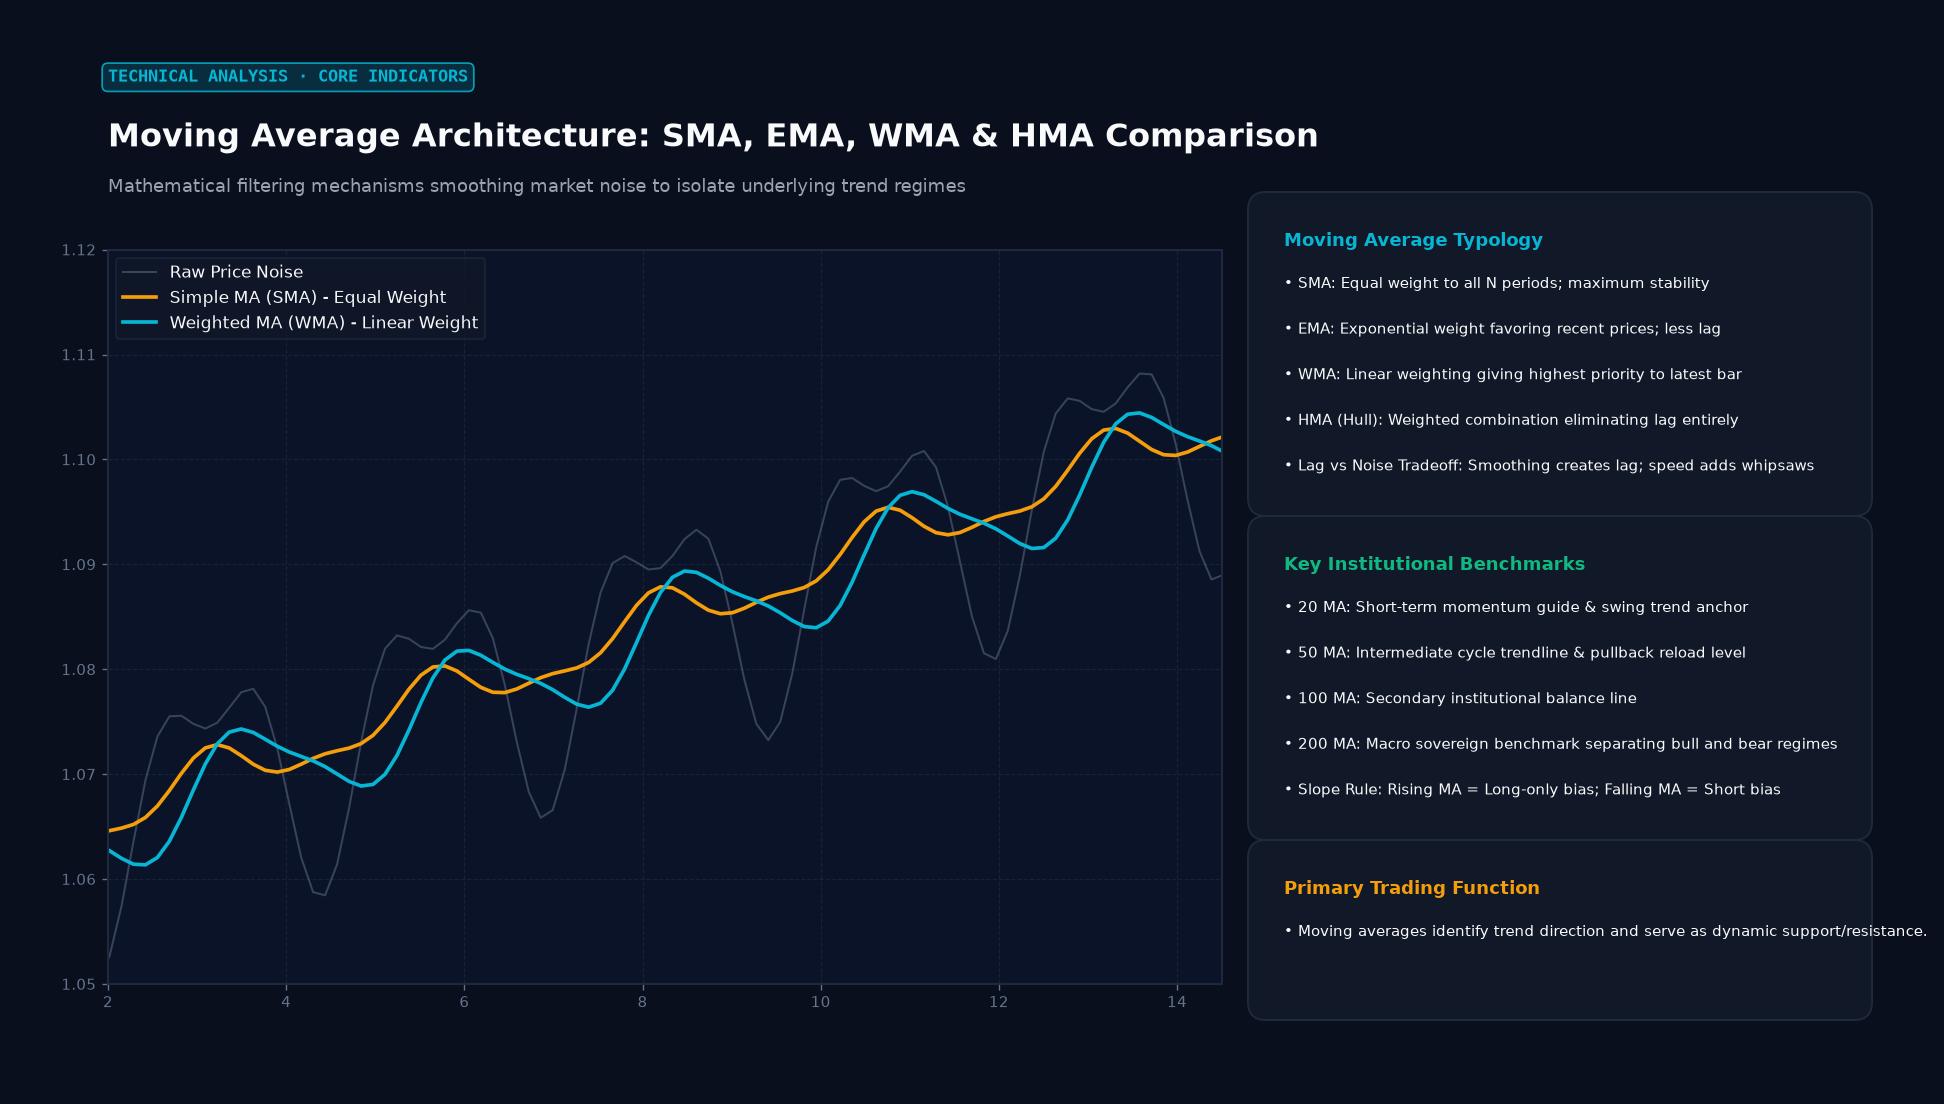 Figure: Mathematical filtering mechanisms smoothing market noise to isolate underlying trend regimes
Simple Moving Average (SMA) vs. Exponential Moving Average (EMA)
The Simple Moving Average treats all prices within the lookback period equally. A 20-period SMA on a daily chart adds the closing prices of the last 20 days and divides by 20. Each day’s close has an equal 5% weight.
The Exponential Moving Average applies a declining weight to older data, giving recent closes a larger influence. The formula uses a smoothing factor: 2/(N+1), where N is the period. On a 20-period EMA, the most recent close receives roughly 9.5% weight, while older closes receive exponentially declining weights.
In practice: EMAs react faster to new price information. In a sharply moving market, an EMA hugs price more closely. SMAs lag more but produce smoother lines with fewer false signals during choppy conditions.
Which to use? Trend-followers who want to respond quickly to momentum shifts prefer EMAs (8 EMA, 21 EMA are common in short-term trading). Swing traders and longer-term analysts often prefer SMAs (50 SMA, 200 SMA) because their greater lag filters out more noise.
Key Moving Average Periods and Their Roles
Certain period settings have become standard reference points, used consistently enough that institutional participants watch them and the levels sometimes become self-fulfilling:
8/9 EMA: Short-term trend filter. In a strong trending market, price often bounces off the 9 EMA during pullbacks. Popular in momentum trading.
20/21 EMA: Intermediate trend. Bollinger Bands use the 20 SMA as their centerline. Many swing traders treat this as the first support in an uptrend.
50 SMA: Medium-term trend benchmark. Widely watched. A break of the 50 SMA on the daily chart is reported in mainstream financial media as a notable technical event.
100 SMA: A less-common intermediate benchmark, sometimes watched in currency markets.
200 SMA: The most-watched long-term trend indicator across all markets. Price above the 200 SMA = long-term uptrend. Below = long-term downtrend. Many institutional funds have mandates that reference the 200 SMA as a portfolio filter.
Moving Average Crossovers
Crossover strategies use two moving averages of different periods. When the shorter-period MA crosses above the longer-period MA, it generates a buy signal. When it crosses below, a sell signal.
The most famous: the Golden Cross (50 SMA crossing above 200 SMA — bullish) and the Death Cross (50 SMA crossing below 200 SMA — bearish). These generate significant media coverage when they occur on major markets.
For shorter-term trading, common crossover combinations include:
- 8 EMA / 21 EMA — fast signals, suitable for daily and 4-hour charts
- 9 EMA / 20 EMA — similar short-term system
- 20 SMA / 50 SMA — intermediate crossover, fewer signals
The weakness of crossover systems: they’re inherently lagging. By the time a crossover confirms a trend change, the market has already moved significantly. They tend to perform well in strongly trending markets and poorly in choppy, sideways conditions.
Moving Averages as Dynamic Support and Resistance
In trending markets, moving averages act as dynamic support (in uptrends) or dynamic resistance (in downtrends). Price pulls back to the moving average and then continues in the direction of the trend — a pattern that repeats often enough to trade systematically.
EUR/USD pulling back from a rally to test the rising 50 SMA before continuing higher is a textbook setup. The quality of the signal depends on how cleanly price respects the level, how many times it’s been tested (more tests without breach = stronger), and whether other factors (Fibonacci levels, prior structure) align at the same zone.
Applying Multiple Moving Averages
Stacking several MAs of different periods on the same chart shows you the trend at multiple timescales simultaneously. When the 20 EMA is above the 50 SMA, which is above the 200 SMA — all moving in the same direction — that’s a strongly aligned trend across timeframes. Many professional trend-following systems use this “moving average alignment” as a prerequisite before taking any trade.
Key Takeaways
- SMAs weight all periods equally; EMAs weight recent periods more heavily
- EMAs react faster; SMAs are smoother and lag more
- Key periods: 9, 20, 50, 200 — each representing a different trend horizon
- Golden Cross (50/200 SMA) and Death Cross are widely watched institutional signals
- Moving averages function as dynamic support and resistance in trending conditions
FAQ
Which is better — SMA or EMA? Neither is universally superior. EMAs work better in trending, fast-moving conditions. SMAs work better in filtering signals during choppy markets. Most professional systems use both: EMAs for short-term momentum signals, SMAs for key structural reference levels.
Why does the 200 SMA attract so much attention? Widespread institutional use creates a feedback loop. When enough participants watch and trade around the 200 SMA, the level becomes significant because everyone expects it to be. This is a legitimate example of technical analysis as a self-fulfilling mechanism at scale.
Ready to trade forex?
Open a free demo account with a regulated broker. Practice with virtual funds before risking real money.