Transaction Cost
Transaction cost represents the aggregate direct and indirect expenses incurred when executing a financial trade, encompassing explicit fees (commissions, clearing charges, regulatory levies) and implicit market frictions (bid-ask spread, market impact, slippage, and opportunity cost).
What Is a Transaction Cost?
In financial market microstructure, a transaction cost is the total monetary drag incurred by a market participant to enter, maintain, and exit a trade. While retail investors frequently focus solely on explicit headline expenses—such as brokerage commissions or account maintenance fees—institutional asset managers view transaction costs as a multidimensional spectrum dominated by implicit market frictions.
Transaction costs act as a perpetual friction against investment alpha. In high-turnover algorithmic trading and quantitative hedge funds, minimizing transaction frictions is often the single most critical determinant of whether an investment strategy achieves a positive Sharpe ratio or suffers slow capital attrition.
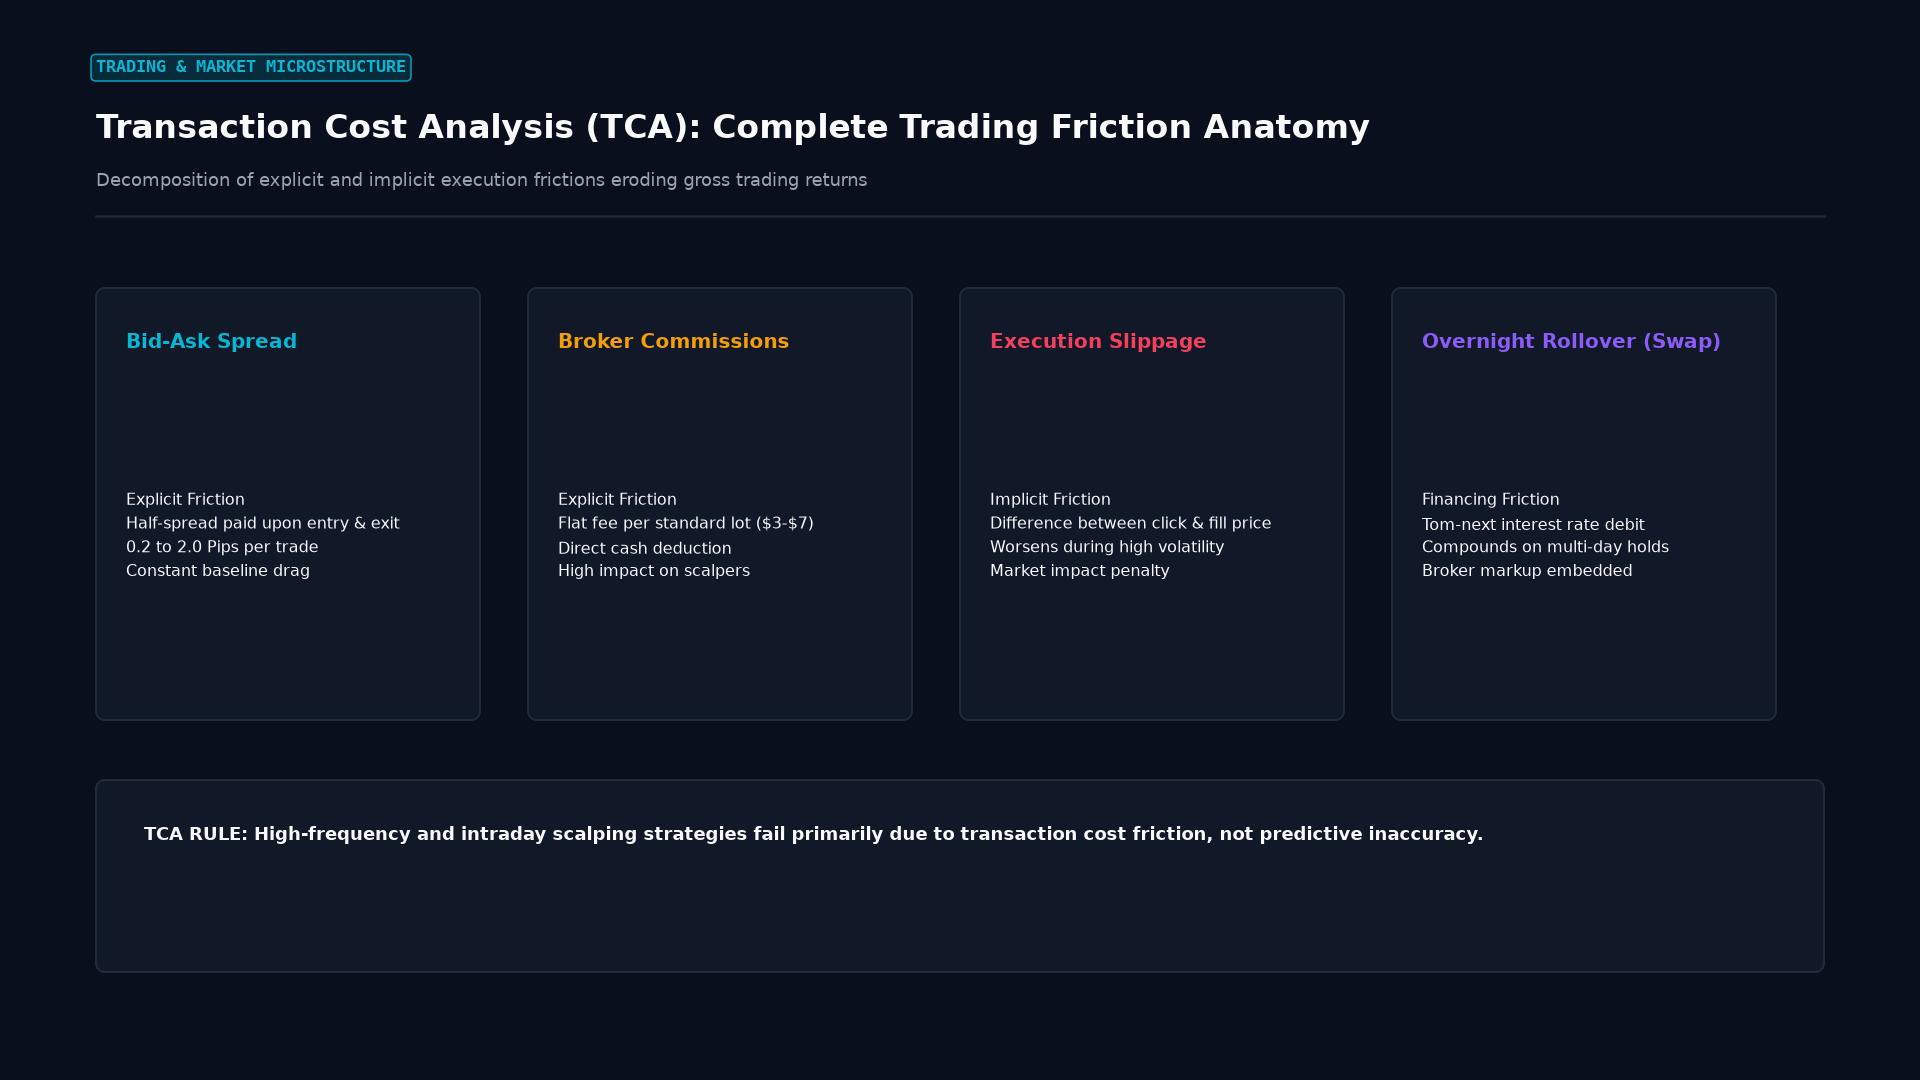 Figure: Execution friction components: bid-ask spreads, broker commissions, execution slippage, and overnight financing swaps eroding gross returns.
The Taxonomy of Transaction Costs
Institutional investors dissect execution drag into two primary classes:
1. Explicit Costs
Direct, quantifiable cash outlays invoiced directly on the trade confirmation slip:
- Brokerage Commissions: Fixed or tiered fees charged by executing brokers (e.g., $$15$ per million USD notional in ECN foreign exchange).
- Exchange & Clearing Fees: Levies collected by centralized exchanges (e.g., CME) or clearing houses (e.g., LCH, DTCC).
- Stamp Duties & Taxes: Financial transaction taxes (e.g., UK $0.5%$ Stamp Duty Reserve Tax on UK equities).
2. Implicit Costs
Indirect costs embedded inside the executable market pricing:
- Half-Spread Cost: The cost of crossing the prevailing spread to execute immediately at market: $$\text{Cost}{\text{spread}} = \frac{P{\text{ask}} - P_{\text{bid}}}{2} \times \text{Volume}$$
- Market Impact: The adverse price movement caused by the execution of a large block order absorbing available depth in the order book.
- Latency Slippage: The price movement occurring between the millisecond a trade decision is dispatched and when it reaches the matching engine.
- Delay / Opportunity Cost: The lost profit resulting from an order remaining unfilled or partially filled when the market trends away.
Mathematical Formulation: Implementation Shortfall
The institutional gold standard for evaluating transaction costs is the Implementation Shortfall (IS) framework, introduced by André Perold in 1988. Implementation Shortfall compares the actual return of a live portfolio against the hypothetical return of a zero-friction “paper portfolio” evaluated at the decision price ($P_d$):
$$\text{Total IS} = \frac{\sum_{j=1}^{k} S_j P_j + \text{Explicit Fees} + (S_{\text{target}} - \sum S_j) P_n - S_{\text{target}} P_d}{S_{\text{target}} P_d}$$
Where:
- $P_d$: Benchmark decision price when the investment decision was finalized.
- $P_j$: Actual execution price of the $j$-th partial fill of volume $S_j$.
- $P_n$: Final market price at the conclusion of the trading window for unfilled volume.
- $S_{\text{target}}$: Total intended order volume.
Almgren-Chriss Market Impact Function
Under the canonical Almgren-Chriss optimal execution model, market impact is split into permanent and temporary components:
$$\Delta P_{\text{permanent}} = \gamma \left( \frac{V}{\text{ADV}} \right), \quad \Delta P_{\text{temporary}} = \eta \left( \frac{v}{\tau} \right)^\alpha$$
Where $V$ is total order size, $\text{ADV}$ is Average Daily Volume, $v/\tau$ is the instantaneous trading velocity, and $\gamma, \eta$ are empirical market microstructure coefficients.
Cost Comparison Across Trading Asset Classes
| Asset Class | Primary Cost Driver | Typical Explicit Fees | Typical Implicit Spread | Market Impact Vulnerability |
|---|---|---|---|---|
| G10 Spot FX (EUR/USD) | Bid-Ask Spread & ECN commission | $$10$–$$25$ per $$1\text{M}$ notional | $0.1$–$0.3$ pips | Extremely low in normal sessions; surges during rollover |
| Emerging Market FX (USD/TRY) | Wide spreads & sovereign carry | $$30$–$$80$ per $$1\text{M}$ notional | $5.0$–$25.0$ pips | High; thin order book depth amplifies slippage |
| Large-Cap US Equities | Market Impact on block orders | $$0.003$–$$0.005$ per share | $$0.01$ (1 cent tick) | Moderate; mitigated by dark pool routing |
| Exchange Futures (CME ES) | Exchange clearing fees | $$1.50$–$$2.50$ per contract | $0.25$ index points | Low; massive centralized book depth |
Real-World Institutional Case Study: The 16:00 London Fix Benchmark Rigging
The profound impact of hidden transaction costs was exposed between 2013 and 2015 during the international investigation into the rigging of the WM/Reuters 16:00 London Fix—the primary benchmark used by pension funds, multi-asset managers, and multinational corporations to value cross-border portfolios.
Institutional asset managers routinely submitted “at-Fix” market orders to major dealer banks (Citigroup, JPMorgan, Barclays, UBS, RBS), accepting whatever fixing price was printed at 16:00 under the assumption that the banks charged zero explicit commissions for executing benchmark rebalancings.
[Institutional Client Perspective]
Zero Commission "Free" Execution at 16:00 London Fix Benchmark

[Interbank Reality: The "Cartel" Chatrooms]
Traders colluded via private chats 15 minutes prior to 16:00
                    |
                    v
Aggregated client order flow: "We have a massive Net Buy Fix today"
                    |
                    v
Traders front-ran benchmark by aggressively buying spot FX ahead of the fix window
                    |
                    v
Artificial price spike driven right into 16:00:00 Fix
                    |
                    v
Dealers filled client buy orders at inflated peak price, keeping huge trading profits
Result: Over $10 Billion in regulatory fines; massive expansion of independent TCA mandates
By intentionally manipulating market liquidity to drive benchmark prices higher ahead of client fills, dealer desks imposed billions of dollars in implicit transaction costs onto pension beneficiaries while advertising the service as “commission-free.” This scandal led global regulators to enforce strict Transaction Cost Analysis (TCA) mandates requiring asset managers to independently benchmark every execution against VWAP and pre-trade arrival prices.
Frequently Asked Questions
Why do “zero-commission” retail brokers still have transaction costs?
While zero-commission brokers eliminate explicit ticket fees, they monetize client order flow via Payment for Order Flow (PFOF) or by widening the bid-ask spread. Retail orders routed to internal market makers are filled with slightly wider spreads or reduced price improvement, meaning the trader pays indirect transaction costs embedded within every execution.
What is Transaction Cost Analysis (TCA)?
Transaction Cost Analysis (TCA) is an institutional quantitative methodology that audits execution quality. By comparing the execution price of every trade against standard benchmarks (Arrival Price, TWAP, VWAP, and Post-Trade Close), TCA breaks down whether an asset manager’s transaction drag stemmed from broker fees, poor timing, wide spreads, or excessive market impact.
How do algorithmic execution strategies minimize transaction costs?
Execution algorithms such as TWAP (Time-Weighted Average Price) and VWAP (Volume-Weighted Average Price) slice large parent orders into hundreds of micro-child orders distributed over minutes or hours. By matching the natural liquidity profile of the market, algorithmic slicing prevents order book depletion, drastically cutting temporary market impact and execution slippage.
Ready to trade forex?
Open a free demo account with a regulated broker. Practice with virtual funds before risking real money.