Turnover
Turnover is the aggregate monetary value or cumulative volume of financial contracts traded across a market, exchange, or portfolio over a designated timeframe, measuring market liquidity, capital velocity, and trading intensity.
What Is Turnover?
In capital markets and macroeconomic analysis, turnover quantifies the aggregate volume or gross monetary value of financial instruments exchanged between buyers and sellers across a specific market, clearing house, or investment portfolio over a defined period (such as daily, monthly, or annually). Turnover serves as the definitive empirical gauge of market liquidity: elevated turnover reflects active price discovery, tight bid-ask spreads, and deep order book capacity capable of absorbing large block orders without significant price dislocation.
In the foreign exchange market, turnover represents the absolute pinnacle of global financial liquidity. According to the Bank for International Settlements (BIS), daily global foreign exchange turnover reached an unprecedented $$7.5$ trillion in 2022, exceeding the combined daily turnover of every global equity and sovereign debt market in existence.
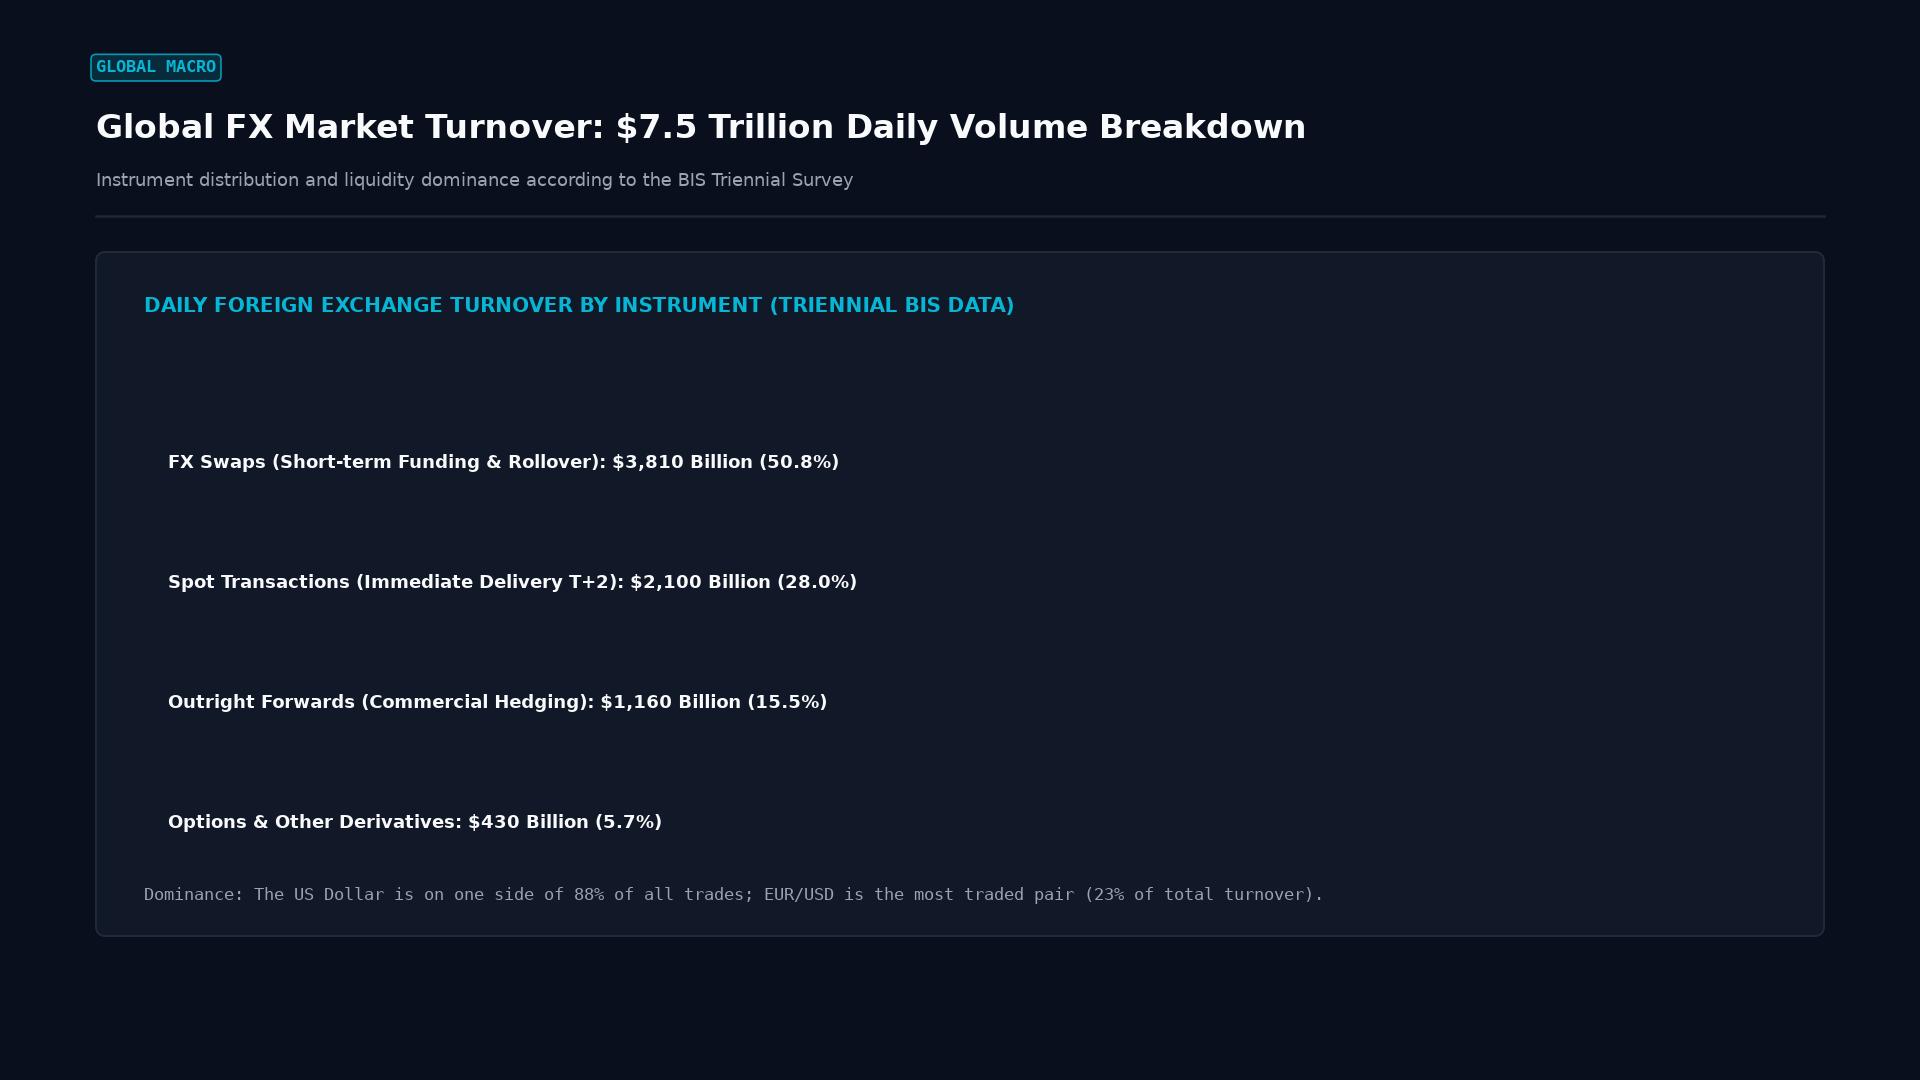 Figure: Global currency volume distribution from BIS data: FX swaps dominance (50.8%), spot transactions (28%), outright forwards (15.5%), and options.
Mathematical Formulation of Turnover Metrics
Turnover is calculated differently depending on whether it evaluates market-wide transaction flow or investment portfolio churn.
1. Gross Dollar Turnover (Market Level)
The total monetary value executed across an exchange or electronic communication network (ECN) over period $T$:
$$\text{Turnover}T = \sum{i=1}^{N} \left( P_i \times Q_i \right)$$
Where $P_i$ is the execution price and $Q_i$ is the quantity or notional volume of transaction $i$.
2. Portfolio Turnover Rate (Fund Management)
In asset management, the portfolio turnover rate measures how frequently a fund manager buys and sells securities relative to total fund size:
$$\text{Turnover Rate (%)} = \frac{\min(\text{Total Purchases}, \text{Total Sales})}{\text{Average Net Asset Value (NAV)}} \times 100$$
A fund with $$100\text{ million}$ in average NAV that executes $$80\text{ million}$ in purchases and $$110\text{ million}$ in sales exhibits an $80%$ turnover rate, implying an average asset holding duration of $1.25$ years.
3. The Amihud Illiquidity Ratio
Turnover directly influences the price impact of trading, captured by Yakov Amihud’s illiquidity measure ($\text{ILLIQ}$):
$$\text{ILLIQ}t = \frac{1}{D_t} \sum{d=1}^{D_t} \frac{|R_{t,d}|}{\text{Turnover}_{t,d}}$$
Where $|R_{t,d}|$ is the absolute daily return and $\text{Turnover}_{t,d}$ is the dollar turnover on day $d$. Low $\text{ILLIQ}$ values denote deep, highly liquid markets where multi-million-dollar turnover induces negligible price volatility.
Market Turnover vs. Portfolio Metrics
Financial analysts differentiate turnover concepts to avoid conflating market liquidity with operational portfolio costs:
| Dimension | Primary Metric | Core Interpretation | High Turnover Implication |
|---|---|---|---|
| Market Turnover | Gross Daily Notional Traded | Macroeconomic market depth and liquidity velocity. | Tighter spreads, lower slippage, robust price discovery. |
| Portfolio Turnover | Annual Churn Rate (%) | Trading frequency of an active fund manager. | Higher transaction costs, tax drag, elevated broker commissions. |
| Share Turnover | $\frac{\text{Shares Traded}}{\text{Shares Outstanding}}$ | Proportion of an equity’s float changing hands. | Elevated public interest, institutional institutional participation. |
| Inventory Turnover | $\frac{\text{COGS}}{\text{Average Inventory}}$ | Corporate supply chain and sales efficiency. | Lean operations, rapid working capital cycle. |
Turnover Concentration in Foreign Exchange
Global foreign exchange turnover is characterized by extreme structural concentration across currencies, financial centers, and executing counterparty types:
Currency Pair Breakdown (% of Global Daily Turnover):
1. EUR/USD: 22.7% ($1.70 Trillion)
2. USD/JPY: 13.5% ($1.01 Trillion)
3. GBP/USD:  9.5% ($0.71 Trillion)
4. AUD/USD:  5.1% ($0.38 Trillion)
* Note: Because each FX transaction involves two currencies, gross percentages sum to 200%.
* The US Dollar was on one side of 88.5% of all global foreign exchange transactions in 2022.
Geographically, turnover is dominated by four global financial hubs: the United Kingdom (London) captures roughly $38%$ of daily global turnover, followed by the United States (New York) at $19%$, Singapore at $9%$, and Hong Kong at $7%$.
Real-World Institutional Case Study: The Rise of Non-Bank Market Makers in FX Turnover
Historically, foreign exchange turnover was the exclusive preserve of Tier-1 interbank dealers (Deutsche Bank, Citi, Barclays, UBS, JPMorgan). These institutions served as the sole liquidity providers, quoting two-way prices to corporations, central banks, and institutional asset managers.
Over the past decade, technological advances in algorithmic execution and microsecond matching fundamentally transformed FX turnover composition. Non-bank electronic market makers—including Citadel Securities, XTX Markets, Jump Trading, and Virtu Financial—began deploying quantitative market-making algorithms directly into multi-dealer platforms (EBS, Refinitiv FXall, FastMatch).
[Traditional FX Turnover (Pre-2010)]
Client -> Tier-1 Dealer Bank -> Interbank Dealing (Human Voice / Direct Lines)

[Modern High-Frequency Turnover (2020s)]
Client -> Smart Order Router -> Aggregated ECN Pool
                                      |
         +----------------------------+----------------------------+
         v                                                         v
Tier-1 Dealer Algorithms (45% Volume)     Non-Bank Electronic Quoting (55% Volume)
(JPMorgan, Citi, BNP Paribas)             (XTX Markets, Citadel, Jump Trading)
By 2020, Euromoney surveys revealed that non-bank principal trading firms had surpassed several bulge-bracket investment banks in spot FX turnover. By operating with lower regulatory capital overhead and leveraging sub-millisecond predictive inventory models, non-bank market makers compressed G10 spot spreads below $0.1$ pips, driving record global turnover even as traditional bank trading desks downsized balance sheet allocations.
Frequently Asked Questions
What is the distinction between volume and turnover?
Volume refers to the raw number of units or contracts traded over a given timeframe (e.g., 50,000 futures contracts or 1 million shares). Turnover refers to the total monetary cash value represented by those traded contracts (i.e., $\sum \text{Volume} \times \text{Price}$). In FX markets, turnover is virtually always quoted in US Dollar equivalents rather than unit volume.
Why does high market turnover benefit retail and institutional traders?
High turnover indicates that numerous buyers and sellers are actively submitting limit and market orders across multiple price levels. This deep liquidity narrows the bid-ask spread, minimizes market impact for large order executions, and substantially reduces the likelihood of catastrophic price gaps during economic announcements.
How does high portfolio turnover affect an investment fund’s performance?
High portfolio turnover increases transaction costs—such as brokerage commissions, bid-ask spread crossing costs, and market impact drag. Furthermore, in taxable accounts, rapid turnover accelerates the realization of short-term capital gains, which are taxed at higher marginal rates than long-term capital gains, often diminishing net after-tax returns.
Ready to trade forex?
Open a free demo account with a regulated broker. Practice with virtual funds before risking real money.