University of Michigan Consumer Sentiment Index
The University of Michigan Consumer Sentiment Index (MCSI) is a premier macroeconomic survey metric that measures US consumer optimism regarding personal finances, business conditions, and medium-to-long-term inflation expectations.
What Is the University of Michigan Consumer Sentiment Index?
The University of Michigan Consumer Sentiment Index (MCSI)—conducted by the Survey Research Center at the University of Michigan—is one of the most closely monitored leading economic indicators in global financial markets. Because consumer spending accounts for approximately $70%$ of United States Gross Domestic Product (GDP), changes in consumer attitudes regarding employment stability, income growth, and purchasing power provide vital early signals regarding aggregate economic momentum.
Published twice monthly (a Preliminary release mid-month followed by a Final release two weeks later), the survey interviews a representative sample of at least 500 US households. In addition to measuring consumer optimism, the survey produces closely watched sub-indexes tracking 1-Year Ahead and 5-to-10-Year Ahead Inflation Expectations, metrics that directly influence Federal Reserve monetary policy deliberations.
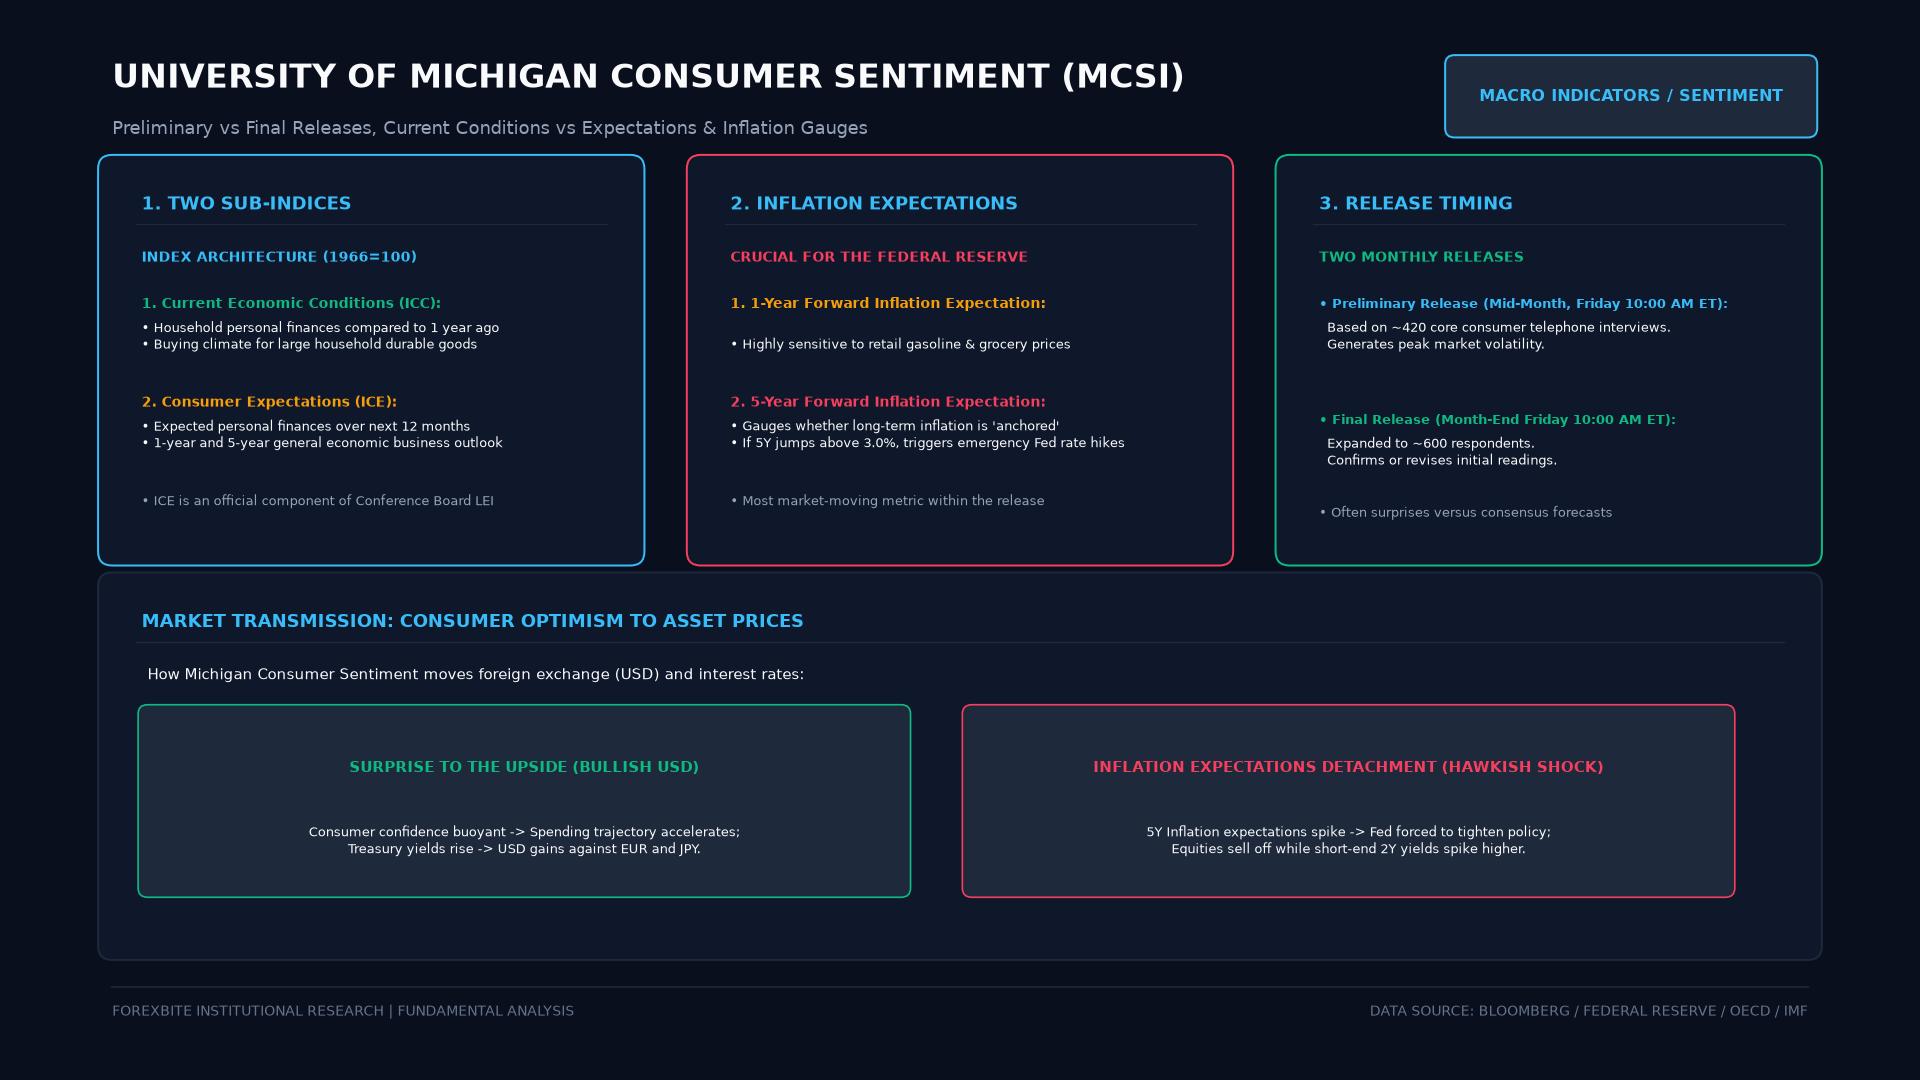 Figure: Structure of the Michigan Consumer Sentiment Index, contrasting Current Economic Conditions (ICC) with Consumer Expectations (ICE), tracking 1-year and 5-year inflation expectations, and their impact on USD assets.
Mathematical Formulation & Index Construction
The index is constructed by aggregating relative favorable versus unfavorable responses across five core survey questions:
1. Relative Score per Question ($X_i$)
For each question $i$, a net score is computed:
$$X_i = \left( % \text{ Favorable Responses} \right) - \left( % \text{ Unfavorable Responses} \right) + 100$$
Where $X_i \in [0, 200]$. A value of $100$ indicates perfect parity between optimistic and pessimistic respondents.
2. The Headline Sentiment Index (ICS)
The five relative scores are summed, normalized against the 1966 base period divisor ($6.7558$), and adjusted by a structural constant ($2.0$):
$$\text{ICS} = \frac{\sum_{i=1}^{5} X_i}{6.7558} + 2.0$$
3. Current Conditions (ICC) vs. Consumer Expectations (ICE)
The survey decomposes sentiment into temporal dimensions:
$$\text{ICC} = \frac{X_1 + X_5}{2.6416} + 2.0, \quad \text{ICE} = \frac{X_2 + X_3 + X_4}{4.1134} + 2.0$$
The Index of Consumer Expectations (ICE) is uniquely prestigious because the Conference Board incorporates it directly into the US Leading Economic Index (LEI).
UMich Sentiment vs. The Conference Board Consumer Confidence
Institutional market participants distinguish between the two primary US consumer confidence surveys:
| Characteristic | University of Michigan (MCSI) | Conference Board (CCI) |
|---|---|---|
| Sample Size | $\approx 500$ households (telephone survey) | $\approx 3,000$ households (online/mail survey) |
| Primary Survey Focus | Personal financial health, inflation, and durable goods purchasing. | Labor market conditions, job availability, and business activity. |
| Base Year | $1966 = 100$ | $1985 = 100$ |
| Release Schedule | Twice monthly (Preliminary mid-month; Final end-month). | Once monthly (Last Tuesday of the month). |
| Inflation Sub-Indices | Quantitative point estimates (1-Year & 5-Year median %). | Qualitative / directional queries. |
| Market Impact | Preliminary release triggers violent FX and bond moves. | Strong equity and broad retail sector impact. |
Inflation Expectations & The Central Bank Reaction Function
While headline consumer optimism impacts retail stocks, foreign exchange and fixed-income desks focus primarily on the Median Expected Inflation Rates:
[University of Michigan Inflation Sub-Indices]
1. 1-Year Inflation Expectations: Tracks consumer perception of immediate CPI path (Gasoline, Groceries).
2. 5-to-10-Year Inflation Expectations: Tracks long-term "anchoring" of inflationary psychology.
If 5-to-10-year inflation expectations breach above the historic $2.8%–3.0%$ corridor, central bankers fear that workers will demand higher wages and businesses will raise prices preemptively, transforming transitory inflation into a self-fulfilling structural wage-price spiral.
Real-World Institutional Case Study: The June 2022 Fed 75 bps Emergency Shock
On Friday, June 10, 2022, the University of Michigan released its Preliminary Consumer Sentiment print for June. The data revealed two alarming developments:
- Headline sentiment collapsed to $50.2$—the lowest reading recorded in the survey’s 70-year history.
- The 5-to-10-Year Inflation Expectations spiked from $3.0%$ to $3.3%$, marking an unanchored breakout to levels not seen since 2008.
[June 10, 2022: 10:00 AM EDT UMich Release]
UMich 5-Year Inflation Expectations Jumps to 3.3%
                      |
                      v
FOMC "Blackout Window" in Effect (Fed officials legally barred from speaking publicly)
                      |
                      v
Federal Reserve Chairman Jerome Powell views the 3.3% jump as an emergency crisis:
Evidence that US inflation expectations are becoming permanently "de-anchored"
                      |
                      v
Fed leaks guidance via Nick Timiraos at The Wall Street Journal on Monday morning:
Fed will abandon its widely telegraphed 50 bps hike in favor of a 75 bps hike
                      |
                      v
June 15 FOMC Meeting: Fed executes its first 75 bps interest rate increase since 1994
Bond yields spiked 30 bps; US Dollar Index (DXY) surged to 20-year highs
In his post-meeting press conference, Chairman Jerome Powell explicitly cited the preliminary Michigan survey release as a primary catalyst that forced the Federal Reserve to escalate its rate-hiking cycle, demonstrating the immense market-moving power of this single data release.
Frequently Asked Questions
Which release moves markets more: the Preliminary or Final UMich report?
The Preliminary release (published around the second Friday of each month) generates significantly higher market volatility than the Final release. Because it provides the financial markets with their first statistical glimpse into consumer psychology for the current month, algorithmic desks aggressively trade the preliminary surprise factor. Revisions in the Final release move markets only if the deviation from the preliminary estimate is unusually wide.
Why do gas prices disproportionately dictate UMich sentiment?
Gasoline is one of the most frequently purchased and visibly priced consumer commodities in the United States. When retail pump prices rise, consumers are constantly reminded of price increases, leading them to report heightened inflation expectations and depressed financial confidence even if core wage growth remains positive.
How does foreign exchange trade on a Consumer Sentiment surprise?
A higher-than-expected headline sentiment reading indicates resilient consumer spending, boosting US GDP growth expectations and strengthening the US Dollar against foreign currencies. Conversely, a spike in the Michigan inflation expectations component can strengthen the US Dollar by prompting the Federal Reserve to adopt a more hawkish interest rate stance.
Ready to trade forex?
Open a free demo account with a regulated broker. Practice with virtual funds before risking real money.