Value-Adding/Non-Value-Adding
In Activity-Based Management (ABM) and Lean operational finance, the classification of enterprise activities based on whether they enhance customer perceived utility or merely consume resources without creating direct economic value.
Value-Adding / Non-Value-Adding Activities
In Activity-Based Management (ABM), Lean operational finance, and Six Sigma workflow engineering, Value-Adding (VA) and Non-Value-Adding (NVA) activity analysis is the systematic process of evaluating every corporate process according to its contribution to customer-perceived utility and enterprise survival. By dissecting operational workflows into granular tasks and mapping their underlying cost drivers, management can identify systemic waste, eliminate unproductive overhead, and redeploy financial capital toward competitive product differentiation.
For financial analysts, corporate restructuring specialists, and private equity sponsors, the proportion of value-adding versus non-value-adding expenditures reveals an organization’s underlying cost structure efficiency. Companies capable of maximizing their value-added ratio generate superior return on invested capital (ROIC) and maintain lower operational break-even thresholds during macroeconomic recessions.
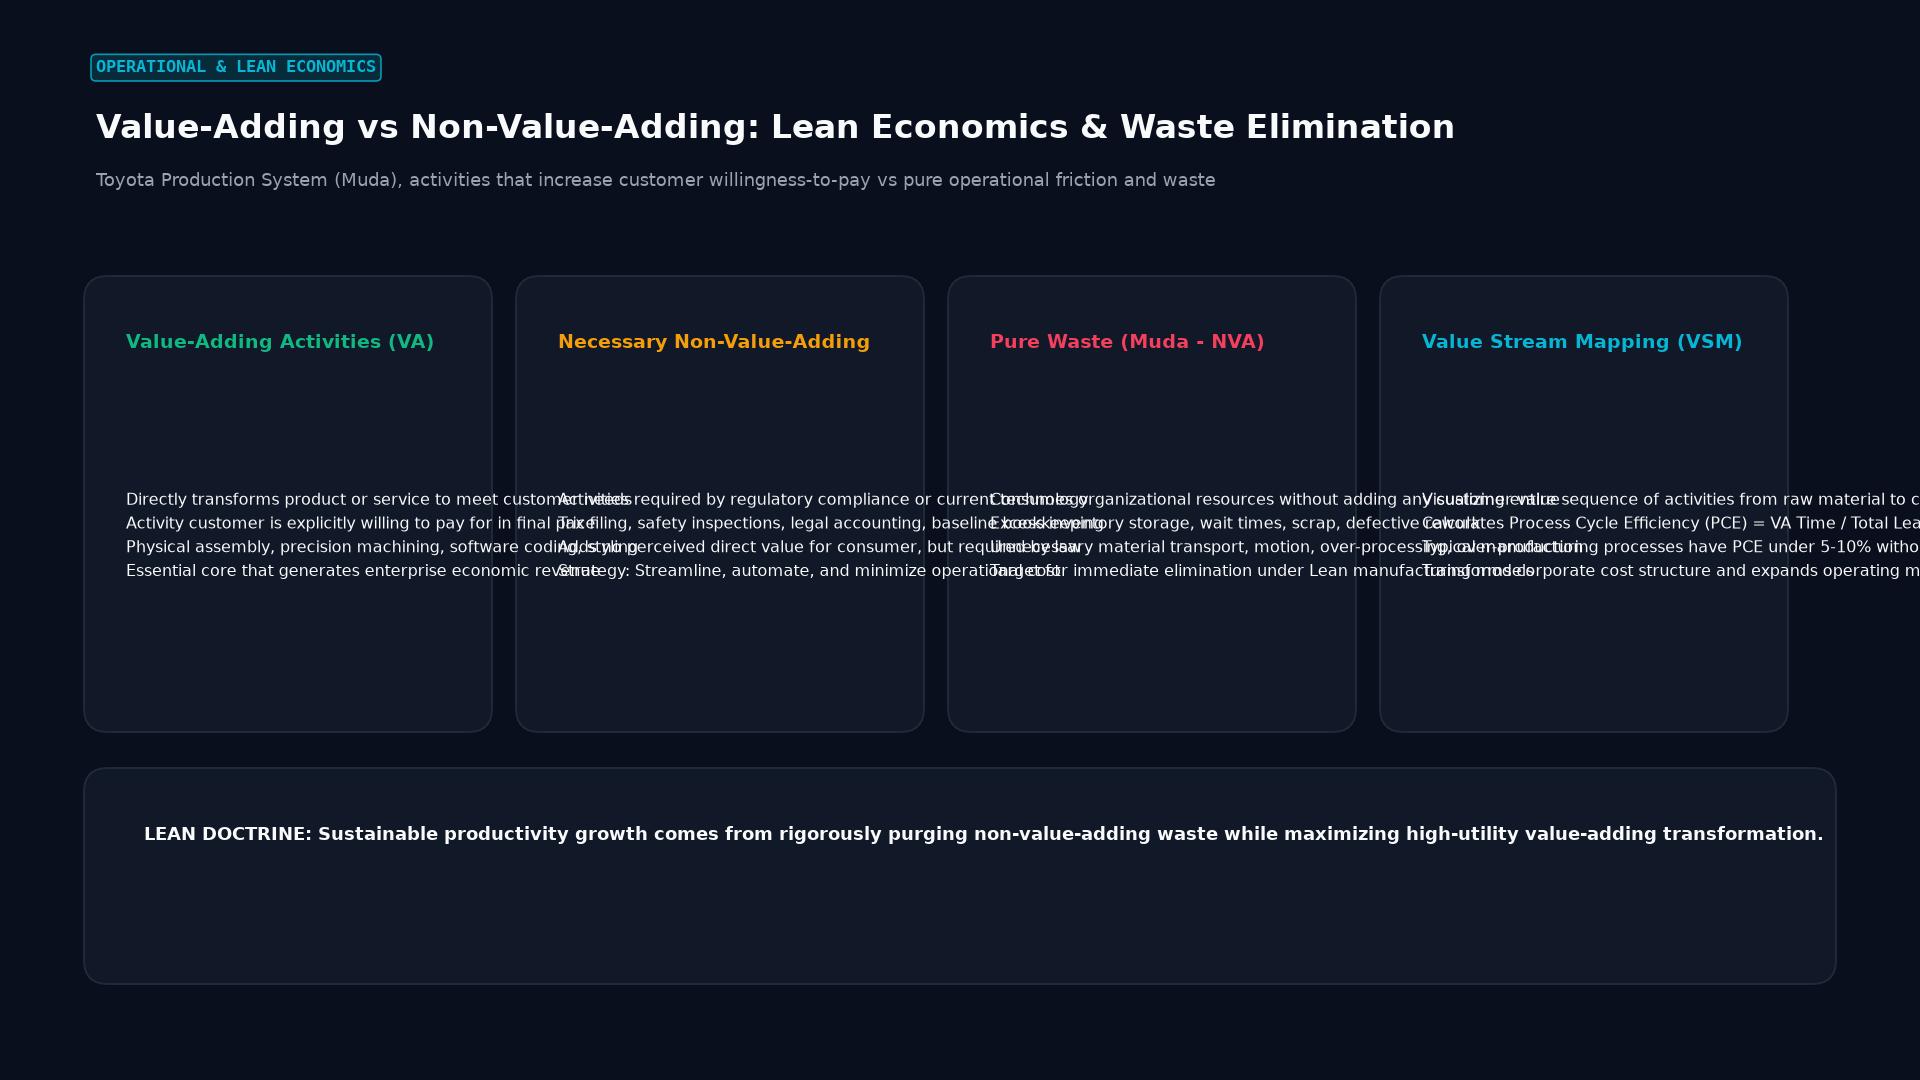 Figure: Toyota Production System (Muda), activities that increase customer willingness-to-pay vs pure operational friction and waste
The Three-Tier Activity Taxonomy
In modern operational accounting, enterprise activities are segmented into three distinct functional tiers rather than a simple binary:
1. Value-Adding Activities (VA)
To qualify as strictly value-adding, an activity must satisfy three rigorous criteria established in Lean manufacturing and service engineering:
- The customer is willing to pay for it: The activity enhances the form, fit, function, or perceived utility of the final product or service.
- Transformational execution: The task physically transforms or advances the work-in-progress (e.g., converting raw silicon into an integrated circuit, or analyzing macroeconomic data into an actionable trade recommendation).
- Right the first time: The activity is executed correctly on its initial attempt, rather than representing rework, patching, or error correction.
2. Business Non-Value-Adding Activities (BNVA / ENVA)
Also termed Essential Non-Value-Adding (ENVA), these activities do not directly enhance customer utility, meaning a client would not voluntarily pay extra for them if given an itemized choice. However, they are indispensable for regulatory compliance, corporate governance, legal defense, and institutional survival:
- Mandatory Financial Disclosures: Preparation of audited quarterly 10-Q and annual 10-K filings under SEC or IFRS mandates.
- Regulatory Compliance: Conducting anti-money laundering (AML), Know Your Customer (KYC), and sanctions screenings on incoming institutional funds.
- Statutory Taxation: Preparing corporate income tax schedules and payroll tax remittances.
- Management Objective: Minimize the operational cost and labor duration of BNVA activities through automated software, standard operating procedures, and straight-through processing (STP), without compromising regulatory compliance.
3. Pure Non-Value-Adding Activities (NVA / Waste / Muda)
Pure non-value-adding activities consume time, physical labor, computational capacity, or financial capital without generating any customer value or fulfilling any regulatory obligation. In Lean terminology, these correspond to Muda (waste), famously categorized into the TIMWOODS framework:
- T - Transportation: Unnecessary physical movement of materials between regional warehouses.
- I - Inventory: Accumulation of excess raw materials, components, or finished goods tying up working capital.
- M - Motion: Inefficient ergonomics or repetitive physical actions by personnel.
- W - Waiting: Employees, automated machines, or transactions idling while awaiting previous workflow steps or managerial approvals.
- O - Overproduction: Producing goods before customer demand exists, leading to storage costs and obsolescence.
- O - Overprocessing: Performing gold-plated, overly intricate specifications beyond what the customer ordered or requires.
- D - Defects: Manufacturing flawed products or generating erroneous trade tickets requiring manual rework or scrap disposal.
- S - Skills Underutilization: Failing to deploy the intellectual and creative capabilities of staff.
Process Cycle Efficiency (PCE) Formulation
To quantify the operational efficiency of an operational process or trading desk, operational analysts calculate Process Cycle Efficiency (PCE), also referred to as the Value-Added Ratio:
$$\text{Process Cycle Efficiency (PCE)} = \left(\frac{\text{Value-Add Processing Time}}{\text{Total Lead Time}}\right) \times 100$$
Where:
- Value-Add Processing Time: The cumulative elapsed duration during which hands-on, transformational work is actively being performed on the product or financial transaction.
- Total Lead Time: The entire elapsed chronological time from the initial receipt of the customer order or trade initiation to its final settlement or delivery, including all queuing, waiting, batching, and inspection intervals.
       Total Lead Time (e.g., 40 Business Hours)
       [================================================================]

       Active Value-Add Processing Time (2 Hours)
       [==]

       Waiting / Inactive Queuing / Transfer Time (38 Hours)
           [============================================================]

       Process Cycle Efficiency = (2 / 40) * 100 = 5.0%
In typical non-optimized industrial and service organizations, PCE frequently measures below 5% to 10%. Applying Lean and ABM principles to eliminate bottlenecks can increase PCE toward 25% to 50%, generating dramatic reductions in operational overhead and working capital requirements.
Detailed Comparison Across Enterprise Dimensions
| Dimension | Value-Adding (VA) | Business Non-Value-Adding (BNVA) | Pure Non-Value-Adding (NVA) |
|---|---|---|---|
| Customer Willingness to Pay | High (Willingly funded by client) | Zero (Client rejects itemized cost) | Negative (Causes customer friction) |
| Regulatory Necessity | Irrelevant to compliance | Essential (Avoids legal penalties) | Zero legal justification |
| Operational Impact | Generates commercial revenue | Protects enterprise operating license | Destroys profit margins |
| Strategic Goal | Optimize, enhance, and expand | Automate, streamline, and compress | Aggressively identify and eliminate |
| Accounting Treatment | Direct product / service cost | General administrative overhead | Unabsorbed cost / Operating waste |
Applied Operational Case Study: Institutional Forex Clearing Desk
To analyze how activity classification drives profitability, consider Meridian Global Prime (MGP), an institutional foreign exchange broker processing institutional cross-border settlements.
Initial Workflow Diagnostic
MGP observed rising operational overhead and customer complaints regarding onboarding delays. Operational consultants conducted an Activity-Based Management audit of the commercial client onboarding process:
- Activity 1: Client Application Intake: Receiving legal registration forms. (Duration: 0.5 hours active work).
- Activity 2: Application Wait Queue: Applications sitting in an email inbox awaiting review. (Duration: 48.0 hours idle waiting).
- Activity 3: AML/KYC Sanctions & Identity Verification: Running corporate entity databases and beneficial ownership checks under FATF regulations. (Duration: 2.0 hours active work).
- Activity 4: Duplicate Data Entry: Manually re-typing customer corporate details from PDF documents into three separate internal legacy risk systems. (Duration: 3.5 hours manual re-entry).
- Activity 5: Defect Correction: Re-contacting client due to typos made during manual entry. (Duration: 4.0 hours back-and-forth).
- Activity 6: Credit Facility Setup & Key Generation: Activating institutional margin limits and providing FIX API trading keys. (Duration: 1.0 hour active work).
Process Cycle Efficiency Calculation (Before Intervention)
- Value-Adding Time (Activities 1, 6): $0.5 + 1.0 = 1.5 \text{ hours}$
- Business Non-Value-Adding Time (Activity 3): $2.0 \text{ hours}$
- Pure Non-Value-Adding Waste (Activities 2, 4, 5): $48.0 + 3.5 + 4.0 = 55.5 \text{ hours}$
- Total Lead Time: $1.5 + 2.0 + 55.5 = 59.0 \text{ hours}$
- Initial PCE: $$\text{PCE} = \left(\frac{1.5}{59.0}\right) \times 100 \approx 2.54%$$
+------------------------------------------------------------------------+
|                Onboarding Activity Financial Audit Table               |
+------------------------------------------------------------------------+
| Activity Description           | Classification | Time (Hrs)| Action   |
| 1. Intake Review               | Value-Adding   | 0.5       | Retain   |
| 2. Inbox Waiting Queue         | Pure NVA (Wait)| 48.0      | Eliminate|
| 3. AML / KYC Compliance Check  | Business NVA   | 2.0       | Automate |
| 4. Triplicate Manual Entry     | Pure NVA (Waste)| 3.5      | Eliminate|
| 5. Typo Rectification Calls   | Pure NVA (Defect)| 4.0     | Eliminate|
| 6. Credit & API Key Delivery   | Value-Adding   | 1.0       | Retain   |
+------------------------------------------------------------------------+
Strategic Re-Engineering Results
MGP implemented automated digital onboarding software with direct API ingestion and integrated compliance verification:
- Application waiting queues were eliminated via automatic routing (saving 48.0 hours).
- Triplicate manual data entry was completely eliminated through automated database synchronization (saving 3.5 hours).
- Data entry defects dropped to zero, eliminating rework calls (saving 4.0 hours).
- Automated AML API checks compressed compliance verification time from 2.0 hours to 0.1 hours.
- New Total Lead Time: $1.5 \text{ (VA)} + 0.1 \text{ (BNVA)} = 1.6 \text{ hours}$.
- Revised PCE: $$\text{New PCE} = \left(\frac{1.5}{1.6}\right) \times 100 \approx 93.75%$$
The desk compressed onboarding turnaround time from 59 hours to under 2 hours, captured substantial market share from institutional hedge funds, and lowered customer acquisition cost by 72%.
Frequently Asked Questions
Can an activity be both value-adding and non-value-adding at the same time?
No. An activity must be categorized strictly according to its primary operational nature. However, a single broad organizational function (such as Quality Management) contains a mixture of sub-activities: conducting final calibration on an instrument is value-adding, maintaining calibration logs for ISO audits is business non-value-adding, and re-inspecting parts that failed previous inspections due to worker error is pure non-value-adding waste.
Why cannot companies eliminate Business Non-Value-Adding (BNVA) activities entirely?
Eliminating BNVA activities would expose an enterprise to catastrophic legal, regulatory, and existential liabilities. For example, stopping annual corporate tax filings, eliminating independent external financial audits, or firing compliance personnel would reduce short-term overhead, but would swiftly trigger regulatory fines, loss of banking licenses, credit rating downgrades, or criminal prosecution.
How does Activity-Based Costing (ABC) assist in identifying non-value-adding costs?
Traditional cost accounting aggregates indirect overhead expenses into broad departmental pools, concealing operational inefficiency. ABC traces costs to specific activities and quantifies their consumption via measurable cost drivers. By exposing the exact dollar expenditures consumed by activities like rework, machine idle time, and dispute resolution, ABC provides management with the objective financial justification to re-engineer or eliminate wasteful processes.
Ready to trade forex?
Open a free demo account with a regulated broker. Practice with virtual funds before risking real money.