Tracing
In managerial accounting and financial analysis, tracing is the systematic assignment of costs directly or via observable cause-and-effect drivers to specific activities, processes, or cost objects without relying on arbitrary allocation.
Tracing (Cost Tracing and Financial Accounting)
In managerial accounting and financial operational analysis, tracing is the process of identifying, measuring, and assigning consumed economic resources directly to specific cost objects, such as individual products, service lines, client accounts, or operational departments. Unlike broad, arbitrary overhead allocations, tracing relies on verified physical observation or empirically established cause-and-effect drivers to determine precisely how and why economic expenses arise during enterprise operations.
Beyond managerial cost control, the concept of tracing holds a critical dual role in forensic finance, legal jurisprudence, and anti-money laundering (AML). In forensic investigations, asset tracing involves tracking the flow of misappropriated capital, stolen investor funds, or laundered proceeds through complex banking networks, commingled accounts, and digital ledgers to establish equitable ownership and secure judicial restitution.
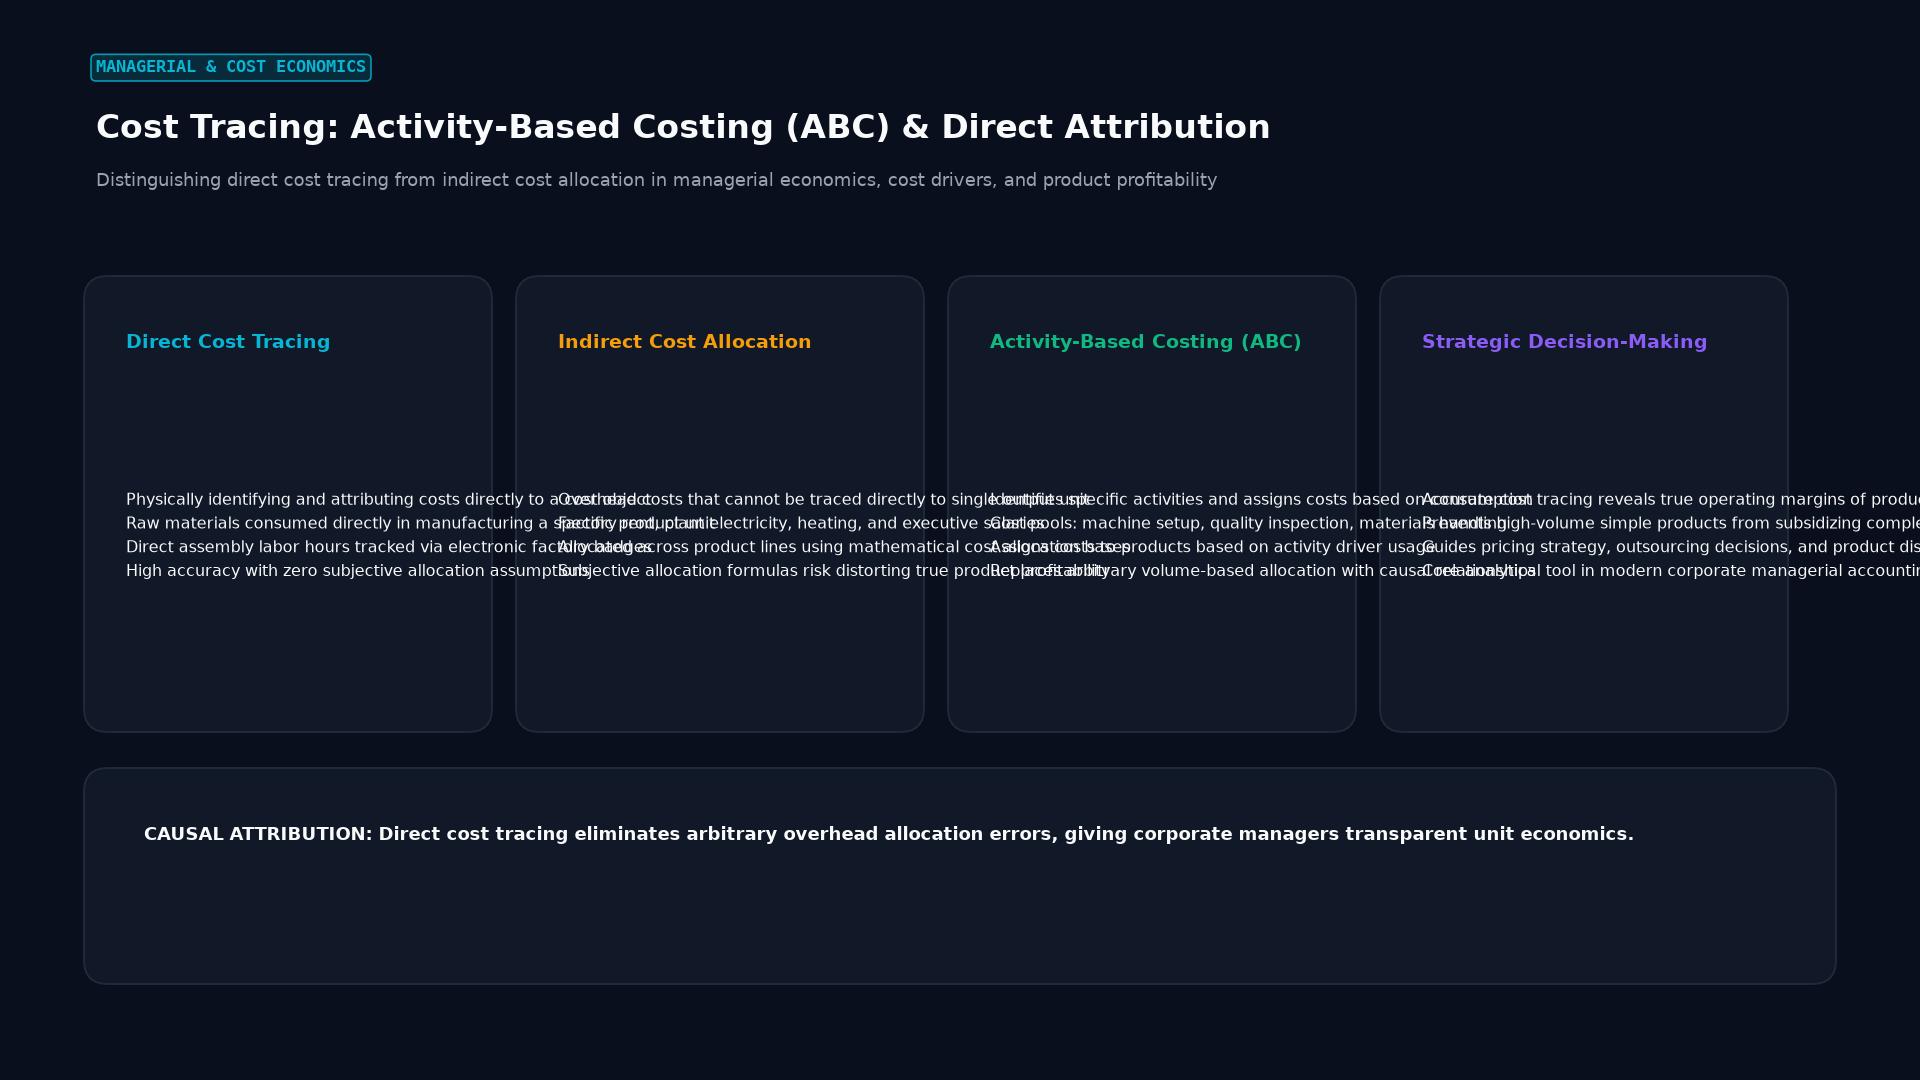 Figure: Distinguishing direct cost tracing from indirect cost allocation in managerial economics, cost drivers, and product profitability
The Mechanics of Cost Tracing in Managerial Accounting
Modern enterprise resource planning (ERP) systems and cost accounting standards classify cost assignment into three distinct methodologies, ranked by precision and causal reliability:
1. Direct Tracing
Direct tracing is the most accurate method of cost assignment. It relies on the physical observation of resource consumption by a specific cost object. If an expense can be tracked exclusively and unambiguously to a single unit or product run, it is classified as a direct cost.
- Example in Manufacturing: Measuring the exact weight of titanium alloy consumed in manufacturing a specific aerospace turbine blade.
- Example in Financial Services: The specific institutional execution and clearing fee paid to an exchange (such as CME or Eurex) for executing a block trade on behalf of a designated prime brokerage client account.
2. Driver Tracing (Activity-Based Costing)
When resources are shared across multiple products or departments, direct physical observation is impossible. In these scenarios, management utilizes driver tracing through Activity-Based Costing (ABC) principles. Driver tracing identifies measurable, causal factors known as cost drivers that capture the consumption relationship between resources, activities, and end cost objects:
- Transaction Drivers: Count the frequency with which an activity is performed (e.g., number of purchase orders processed, number of quality control inspections completed).
- Duration Drivers: Measure the total time required to execute an activity (e.g., machine setup hours, client advisory consult hours, software quality assurance testing time).
- Intensity Drivers: Directly charge the specific resources required for complex, non-standard operations (e.g., specialized algorithmic trading parameter calibration for a bespoke hedge fund mandate).
         Driver Tracing Formula:

         Assigned Cost_i = Activity Cost Pool * (Driver Consumption_i / Total Driver Volume)

         Where:
         Assigned Cost_i = Overhead expense routed to Cost Object i
         Activity Cost Pool = Total aggregated cost of operating the activity
         Driver Consumption_i = Number of driver units consumed by Cost Object i
         Total Driver Volume = Aggregate sum of driver units across all objects
3. Allocation (The Non-Causal Alternative)
When no causal relationship can be identified between resource consumption and a cost object, firms resort to allocation. Allocation distributes costs using arbitrary metrics, such as allocating corporate headquarters executive salaries based on departmental floor space or percentage of total gross revenue. Cost accountants seek to minimize arbitrary allocation by replacing it with direct or driver tracing wherever economically feasible.
Detailed Comparison: Tracing vs. Allocation
| Operational Metric | Direct Tracing | Driver Tracing (ABC) | Arbitrary Allocation |
|---|---|---|---|
| Underlying Basis | Physical observation & direct measurement | Statistical cause-and-effect relationship | Convenient, arbitrary rules of thumb |
| Measurement Accuracy | Highest possible precision | High precision, minor estimation error | Low precision, systematic distortion |
| Implementation Cost | Low to moderate (captured at source) | Moderate to high (tracking driver metrics) | Lowest operational cost |
| Risk of Cross-Subsidization | Zero | Minimal | Severe (high-volume products subsidize low-volume) |
| Strategic Decision Value | Essential for unit profitability | Crucial for pricing and capacity planning | Often misleading for pricing and margins |
Forensic Financial Asset Tracing
In capital markets, corporate investigations, and insolvencies, tracing takes on an equally vital meaning: establishing the legal and factual journey of assets that have been converted, misappropriated, or commingled.
       [Defrauded Investors]
                 |
                 v ($10,000,000)
       [Fraudulent Ponzi Entity Account]
                 |
        +--------+--------+
        |                 |
        v ($4M)           v ($6M)
 [Offshore Shell Co A]  [Commingled Bank Account]
        |                 |
        v                 v
 [Luxury Real Estate]   [Withdrawal: $3M Stolen / $3M Retained]
        |                 |
        +--------+--------+
                 |
                 v
   [Judicial Tracing Order & LIBR Rule Applied]
Common Law vs. Equitable Tracing
- Common Law Tracing: Allows a claimant to follow their original property or its direct substitute, provided the property has not been commingled with other funds or dissolved into an undifferentiated pool. If stolen cash is deposited into a bank account with legitimate funds, the common law right to trace is extinguished.
- Equitable Tracing: A far more flexible legal remedy available in common-law jurisdictions (such as the UK, US, Canada, Australia, and Singapore). Equity allows claimants to assert proprietary claims over commingled bank balances, investment portfolios, or newly acquired assets (such as real estate, yachts, or corporate equity) purchased with misappropriated capital, provided a fiduciary relationship existed or unconscionable receipt occurred.
Key Forensic Tracing Rules
When misappropriated funds are mixed with legitimate assets in a single bank account, forensic accountants and judicial courts apply established legal doctrines to determine ownership:
- The Lowest Intermediate Balance Rule (LIBR): The legal presumption that an investor’s proprietary claim against a commingled account is capped at the lowest balance reached by that account between the time of deposit and the date of judicial freezing. Subsequent deposits by the fraudster from other sources do not replenish the original victim’s equitable fund unless explicitly intended.
- Clayton’s Case (First-In, First-Out / FIFO): Historically used to allocate debits against deposits in a running bank account. While largely superseded in modern complex fraud cases, FIFO assumes that the earliest funds deposited are the earliest funds withdrawn.
- Pro-Rata (Pari Passu) Distribution: The modern prevailing standard in massive investment frauds (such as Madoff or multi-jurisdictional crypto collapses). When multiple innocent victims contribute funds into a commingled vehicle that collapses, remaining recovered assets are distributed proportionally to their net unreturned capital contributions.
Applied Operational Case Study: Eliminating Cost Distortion Through Tracing
To understand the practical power of cost tracing in financial institutions, consider Apex Prime Brokerage (APB), a firm clearing transactions for two distinct institutional client segments:
- Segment A (Quantitative High-Frequency Fund): Generates 5,000,000 standardized electronic algorithmic trades per month with zero manual trade breaks.
- Segment B (Discretionary Distressed-Debt Fund): Generates 5,000 complex, customized, over-the-counter bond and CDS trades per month, requiring intense manual trade reconciliation, compliance vetting, and legal structuring.
Traditional Overhead Allocation (The Flawed Method)
Historically, APB incurred $1,000,000 in monthly back-office operational clearing and compliance overhead. It allocated this cost based strictly on trade volume (number of executed tickets):
- Total trade volume = 5,005,000 trades.
- Overhead rate per trade: $$\text{Rate} = \frac{$1,000,000}{5,005,000} \approx $0.1998 \text{ per trade}$$
- Allocated Cost to Segment A: $$5,000,000 \times $0.1998 = $999,000$$
- Allocated Cost to Segment B: $$5,000 \times $0.1998 = $999$$
Under this arbitrary volume allocation, Segment A appeared unprofitable due to massive assigned clearing expenses, prompting management to consider raising execution commissions on quantitative algorithms.
Implementation of Activity-Based Driver Tracing
APB engaged cost accountants to trace expenses to underlying activities and drivers:
- Activity 1: Automated Server Matching: Total cost = $200,000. Driver = Server transaction volume.
- Segment A consumes 99.9% = $199,800
- Segment B consumes 0.1% = $200
- Activity 2: Manual Trade Reconciliation & Legal Exception Handling: Total cost = $800,000. Driver = Manual review labor hours (Total = 2,000 hours).
- Segment A logged 0 manual exception hours = $0
- Segment B logged 2,000 manual exception hours = $800,000
+------------------------------------------------------------------------+
|               Profitability Distortion Comparison Table                |
+------------------------------------------------------------------------+
| Client Segment       | Arbitrary Allocation   | Driver Tracing (ABC)   |
| Segment A (Algo HFT) | $999,000 (Overstated)  | $199,800 (Accurate)    |
| Segment B (Manual OTC)| $999 (Understated)    | $800,200 (Accurate)    |
+------------------------------------------------------------------------+
By transitioning from volume allocation to driver tracing, management discovered that Segment A was exceptionally profitable, while Segment B had been severely cross-subsidized by the algorithmic business. APB immediately restructured its fee schedule, charging Segment B premium clearing and reconciliation surcharges to reflect actual resource consumption.
Frequently Asked Questions
What is the primary difference between cost tracing and cost allocation?
Cost tracing links expenses to cost objects using direct physical measurement or verified cause-and-effect drivers (such as labor hours or machine cycles), providing high accuracy. Cost allocation assigns indirect expenses using convenient, arbitrary formulas (such as square footage or percentage of total revenue) when no clear causal relationship can be observed.
How does the Lowest Intermediate Balance Rule (LIBR) protect victims in forensic tracing?
LIBR ensures that an equitable claimant tracing misappropriated funds through a commingled bank account cannot claim more money than remained in that account at its lowest point. If a fraudster steals $100,000, spends the account down to $5,000, and later deposits $50,000 from an unrelated loan, the original victim’s proprietary trace is legally capped at $5,000, preventing unjust enrichment at the expense of subsequent creditors.
Why is cost tracing critical for pricing derivative contracts and structured financial products?
Complex financial derivatives require extensive ongoing operational risk management, collateral margin calculations, legal documentation, and regulatory capital reserves. If investment banks allocate these costs arbitrarily across all desks, complex structured desks appear artificially cheap while high-volume flow desks are penalized, leading to mispriced contracts and hidden institutional vulnerabilities.
Ready to trade forex?
Open a free demo account with a regulated broker. Practice with virtual funds before risking real money.