Variance
Variance (symbolized as σ²) is a fundamental statistical metric that quantifies the dispersion of data points around their arithmetic mean, serving as the mathematical foundation for measuring financial volatility, portfolio risk, and asset covariance.
What Is Variance?
In financial mathematics, econometrics, and quantitative portfolio management, variance ($\sigma^2$) measures how widely a set of asset returns is dispersed around its expected value (mean return). High variance indicates that an asset’s returns fluctuate dramatically across a broad distribution, signifying heightened market risk and price instability. Low variance reflects tightly clustered returns around the mean, characteristic of stable cash flows and low volatility.
While finance professionals intuitively discuss risk in terms of volatility or standard deviation ($\sigma$, which is the square root of variance), variance possesses unique additive and linear-algebraic properties that make it the indispensable mathematical engine behind Harry Markowitz’s Modern Portfolio Theory (MPT), Value at Risk (VaR) covariance matrices, and derivative variance swaps.
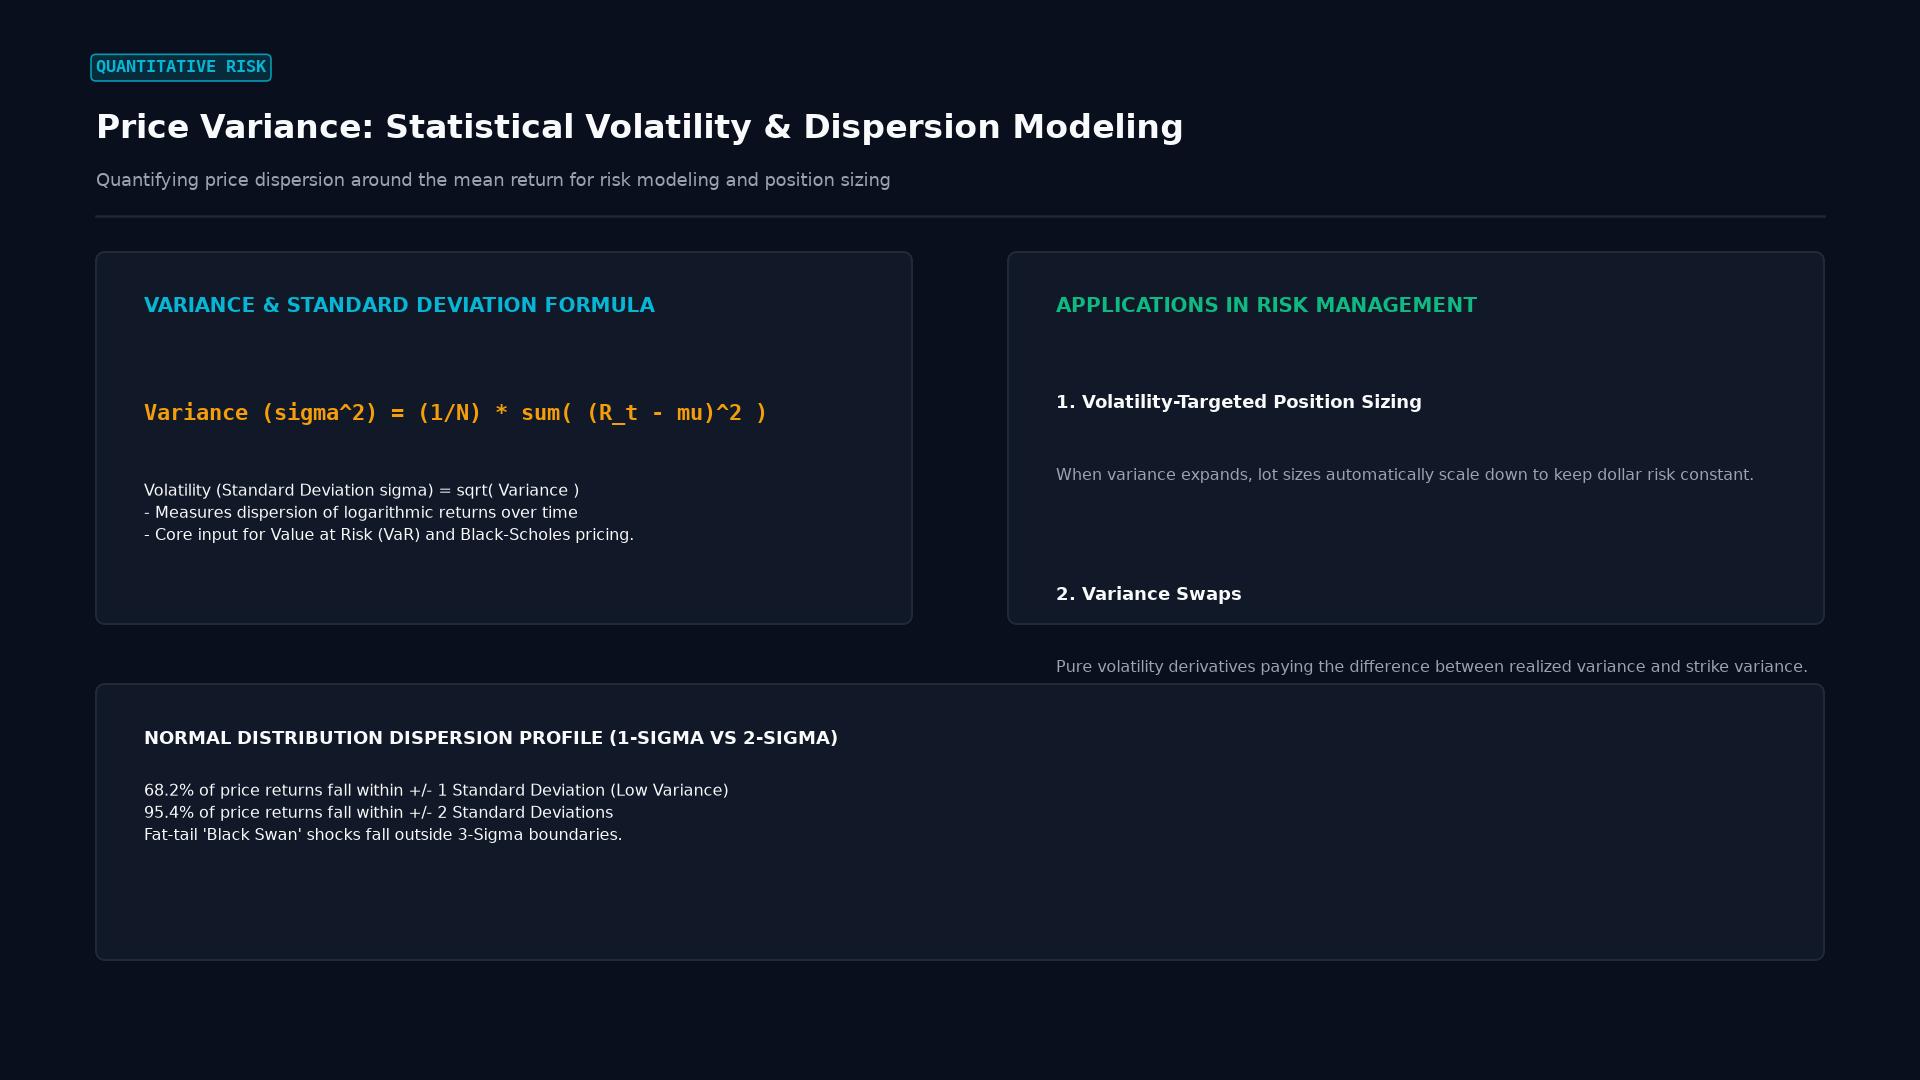 Figure: Statistical return dispersion: variance formulas, standard deviation volatility curves, and volatility-targeted position sizing.
Mathematical Formulation: Asset & Portfolio Dispersion
Mathematically, variance is the expectation of the squared deviation of a random variable from its mean:
$$\sigma^2 = \mathbb{E}\left[ (R - \mathbb{E}[R])^2 \right]$$
1. Sample Variance ($s^2$)
For a historical sample of $N$ observed daily returns $R_1, R_2, \dots, R_N$ with sample mean $\bar{R}$:
$$s^2 = \frac{1}{N - 1} \sum_{i=1}^{N} (R_i - \bar{R})^2$$
Where $N-1$ is Bessel’s correction, eliminating downward sample bias when estimating true population variance.
2. Multi-Asset Portfolio Variance (Markowitz)
For a multi-asset portfolio with weight vector $\mathbf{w} = [w_1, w_2, \dots, w_n]^T$ and covariance matrix $\mathbf{\Sigma}$:
$$\sigma_p^2 = \mathbf{w}^T \mathbf{\Sigma} \mathbf{w} = \sum_{i=1}^{n} w_i^2 \sigma_i^2 + 2 \sum_{i=1}^{n} \sum_{j < i} w_i w_j \text{Cov}(R_i, R_j)$$
This equation formalizes the mathematical miracle of diversification: if the covariance between two assets is negative or uncorrelated ($\text{Cov}(R_i, R_j) \le 0$), the aggregate portfolio variance ($\sigma_p^2$) can be driven significantly below the weighted average variance of its individual constituent assets.
Statistical Risk Metrics Compared
| Metric | Mathematical Notation | Units of Measure | Primary Financial Application |
|---|---|---|---|
| Variance | $\sigma^2 = \frac{\sum (R - \mu)^2}{N}$ | Squared Percentages ($%^2$) | Markowitz mean-variance optimization, variance swap pricing |
| Standard Deviation | $\sigma = \sqrt{\sigma^2}$ | Nominal Percentages ($%$) | Annualized volatility, Sharpe Ratio denominator, Bollinger Bands |
| Semi-Variance | $\sigma_{\text{down}}^2 = \frac{\sum \min(0, R - \text{Target})^2}{N}$ | Squared Percentages ($%^2$) | Sortino Ratio; penalizes only downside losses |
| Covariance | $\text{Cov}(X, Y) = \mathbb{E}[(X - \mu_x)(Y - \mu_y)]$ | Product of Return Units | Measures directional co-movement between two assets |
Trading Pure Volatility: The Variance Swap
In quantitative derivatives markets, institutional volatility arbitrageurs trade variance swaps—over-the-counter contracts that provide pure, unadulterated exposure to realized variance without requiring continuous delta-hedging.
At expiration, the payout ($\Pi$) of a variance swap is strictly linear with respect to the difference between realized annual variance ($\sigma_{\text{realized}}^2$) and the pre-agreed strike variance ($K_{\text{var}}$):
$$\Pi_{\text{var_swap}} = N_{\text{var}} \times (\sigma_{\text{realized}}^2 - K_{\text{var}})$$
Where $N_{\text{var}}$ is the variance notional per volatility point squared. Because the payoff scales with the square of realized volatility, variance swaps exhibit convex payoffs during extreme market crashes, making them the ultimate hedge against tail-risk volatility spikes.
Real-World Institutional Case Study: The March 2020 Variance Explosion
During the onset of the COVID-19 pandemic in March 2020, financial asset variance exploded to levels unseen since the Great Crash of 1929.
Under normal market conditions, the annualized daily variance of the S&P 500 averages approximately $0.0225$ (translating to a standard deviation volatility of $\sigma = \sqrt{0.0225} = 15%$).
[March 2020 Volatility Shock]
Daily market moves reached +/- 5% to 9% for consecutive sessions
Annualized Realized Volatility surged to 82.5%
                    |
                    v
REALIZED VARIANCE EXPLOSION:
Variance = (0.825)^2 = 0.6806 (A 30-Fold Increase over Baseline Variance)
                    |
                    v
IMPACT ON VARIANCE SWAP SELLERS:
Institutional hedge funds that had sold variance at a strike of K_var = 0.0400 (20% vol)
faced catastrophic quadratic liabilities:
Payout = N_var * (0.6806 - 0.0400) = N_var * 0.6406
                    |
                    v
Result: Widespread liquidation of volatility-arbitrage funds (Allianz Structured Alpha collapse)
Because variance squares deviations from the mean, an unexpected surge in price swings delivers quadratic, exponential losses to variance sellers, demonstrating why quantitative risk managers treat variance risk with extreme caution.
Frequently Asked Questions
Why do mathematicians square deviations to calculate variance?
Squaring deviations serves two essential purposes:
- Eliminating Directional Cancellation: If deviations were not squared, positive returns and negative returns would cancel each other out, yielding an average deviation of zero regardless of how volatile the market was.
- Penalizing Outliers: Squaring disproportionately weights large, catastrophic price outliers (a $10%$ crash produces a squared deviation of $100$, whereas a $1%$ dip produces a squared deviation of just $1$), mathematically reflecting the real-world financial damage of tail-risk events.
What is the difference between variance and standard deviation?
Variance ($\sigma^2$) is expressed in squared units (e.g., squared percentage points), making it counter-intuitive for day-to-day conversation. Standard deviation ($\sigma$) is simply the square root of variance, restoring the risk metric back into the exact same units as the underlying asset returns (e.g., an annualized volatility of $16%$).
Why does variance matter for forex traders?
In foreign exchange trading, variance dictates the width of the statistical probability envelope for future exchange rates. High-variance currency pairs (such as GBP/JPY or emerging market pairs like USD/ZAR) require wider stop-loss margins and smaller position lot sizes, whereas low-variance pairs (such as EUR/GBP) allow tighter stops and larger lot allocations under identical capital risk budgets.
Ready to trade forex?
Open a free demo account with a regulated broker. Practice with virtual funds before risking real money.