Volatility Smile / Skew
A volatility smile or skew is the empirical pattern where implied volatility varies across strike prices for options with the same underlying asset and expiration date, directly contradicting the constant-volatility assumption of the Black-Scholes model.
What Is a Volatility Smile and Skew?
In derivatives markets, a volatility smile or volatility skew refers to the observed relationship between the strike price of an option and its implied volatility ($\sigma_{\text{implied}}$) for a fixed expiration date.
The standard Black-Scholes-Merton (BSM) options pricing model mathematically assumes that the volatility of an underlying asset is constant across all strike prices and horizons. If this theoretical assumption held true in practice, plotting implied volatility against strike price would produce a perfectly horizontal line.
In real-world markets, however, options at different strike prices trade at distinctly different implied volatilities. This creates two distinct visual curves:
- Volatility Skew (or Smirk): Prevalent in equity index options, where deep out-of-the-money (OTM) put options command significantly higher implied volatility than at-the-money (ATM) or out-of-the-money call options.
- Volatility Smile: Prevalent in foreign exchange (FX) and commodity options, where both deep out-of-the-money puts and calls trade at higher implied volatilities than at-the-money options, forming a symmetric, U-shaped “smile.”
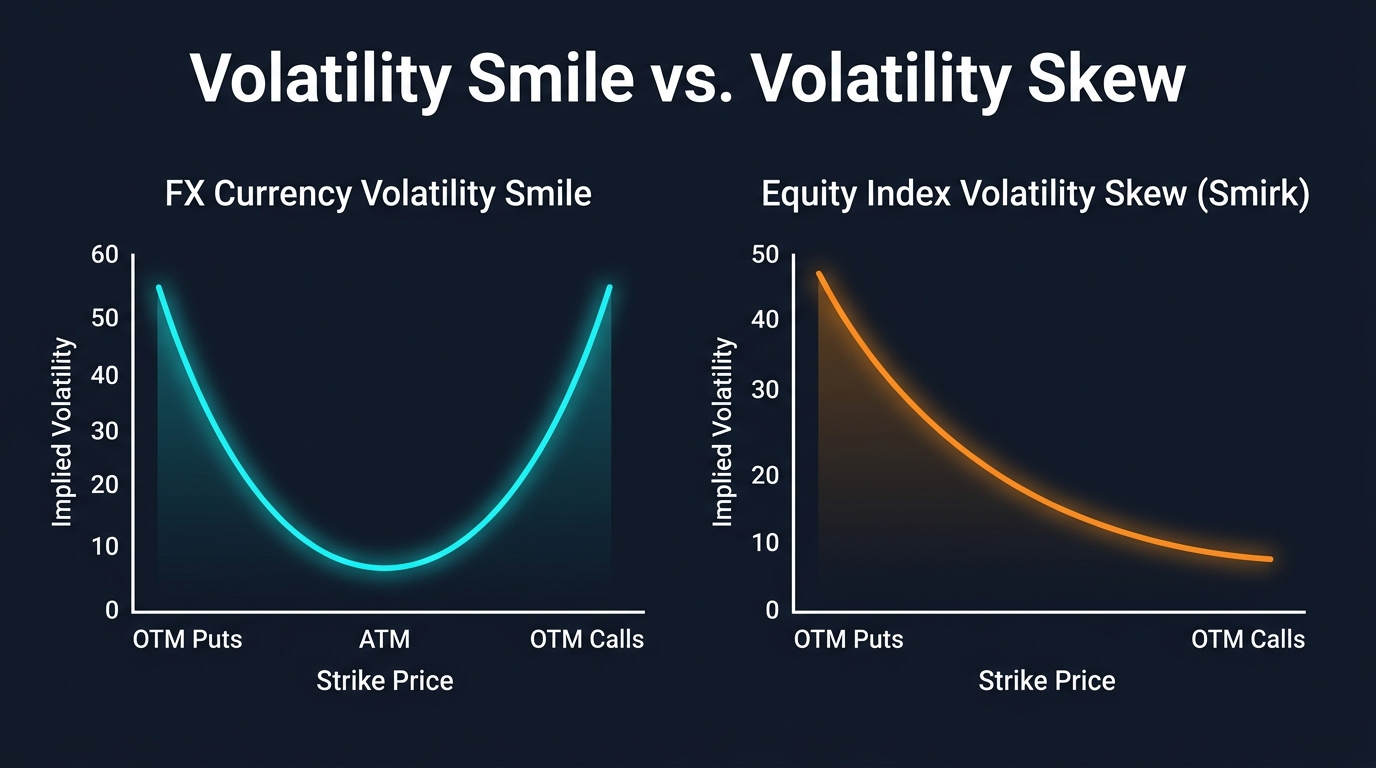
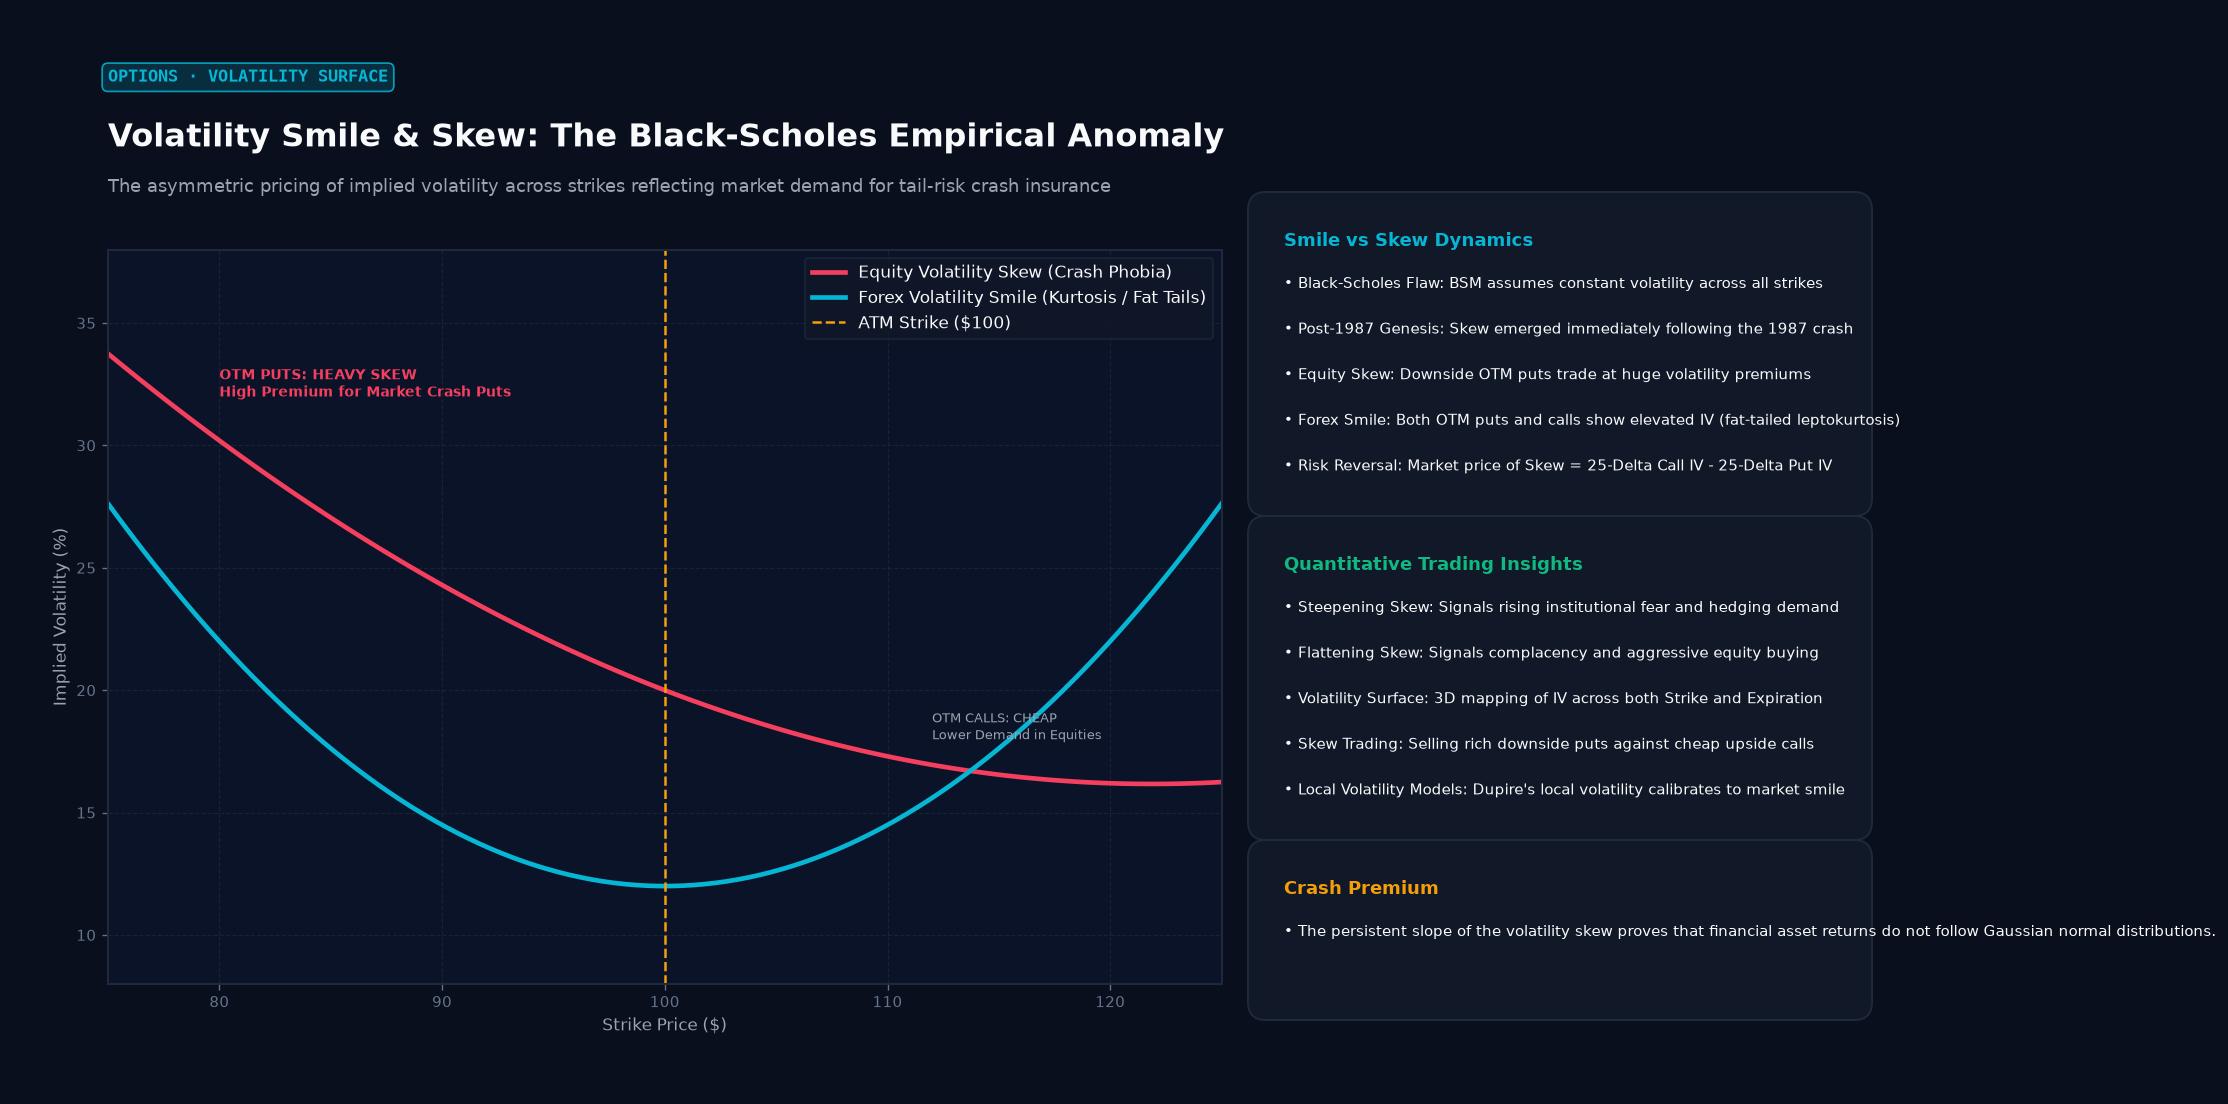 Figure: The asymmetric pricing of implied volatility across strikes reflecting market demand for tail-risk crash insurance
Quantitative Mechanics: Risk Reversals and Butterflies
Institutional currency options desks do not quote prices in currency units or fixed strike prices; they quote options in terms of delta ($\Delta$) and trade volatility surfaces using standard decomposition metrics: the Risk Reversal (RR) and the Strangle / Butterfly (BF).
1. Risk Reversal (Measuring Skewness)
The 25-delta Risk Reversal measures the skew or directional bias between upside and downside tail risks:
$$RR_{25\Delta} = \sigma(\text{Call}{25\Delta}) - \sigma(\text{Put}{25\Delta})$$
- If $RR_{25\Delta} < 0$: Downside puts trade at a volatility premium to upside calls (bearish skew / downside crash protection).
- If $RR_{25\Delta} > 0$: Upside calls trade at a premium to downside puts (bullish skew, common in commodities like gold or crude oil during supply crises).
2. Butterfly / Strangle (Measuring Kurtosis / Smile Curvature)
The 25-delta Butterfly quantifies the degree of smile curvature, reflecting market pricing of extreme tail risk (fat tails or leptokurtosis) relative to normal distributions:
$$BF_{25\Delta} = \frac{\sigma(\text{Call}{25\Delta}) + \sigma(\text{Put}{25\Delta})}{2} - \sigma_{\text{ATM}}$$
A higher Butterfly value indicates that the market expects extreme jump-diffusion events or fat-tailed distributions rather than smooth Brownian motion.
Comparison of Volatility Surface Structures
| Volatility Structure | Underlying Shape | Dominant Asset Classes | Underlying Market Driver |
|---|---|---|---|
| Downward Skew (Smirk) | Asymmetric downward slope (Puts > Calls) | Equity Indices (S&P 500, DAX, FTSE) | Institutional crash phobia, leverage effect, structural put hedging |
| Symmetric Smile | U-shaped curve (OTM Puts $\approx$ OTM Calls > ATM) | G10 Currencies (EUR/USD, GBP/USD) | Two-sided macroeconomic tail risks, leptokurtic FX distributions |
| Upward Skew | Asymmetric upward slope (Calls > Puts) | Agricultural & Energy Commodities | Supply disruption fears, physical shortages, upside spike risk |
| Term Structure | Volatility across expiration tenors | All derivative markets | Forward event risk (elections, central bank rate decisions) |
Historical Case Study: Black Monday (1987) & The Brexit Skew (2016)
The Birth of the Equity Skew: October 19, 1987
Prior to the Black Monday crash of October 19, 1987, empirical option prices closely tracked a flat Black-Scholes surface. The market assumed that stock returns followed a standard Gaussian normal distribution where a 20% single-day crash was mathematically impossible (a 20-sigma event occurring once in several billion years).
When the Dow Jones Industrial Average plunged 22.6% in a single trading session, market participants realized that stock distributions exhibit heavy left-tail risk. Since that day, index options have permanently traded with a steep downward volatility skew as institutional fund managers continuously bid up out-of-the-money puts to guard against systemic liquidity events.
The Brexit Referendum FX Skew: June 2016
Leading up to the United Kingdom’s European Union membership referendum on June 23, 2016, the GBP/USD options surface experienced the most extreme skew inversion in the history of modern currency markets:
- Baseline GBP/USD 1-month 25-delta risk reversals historically traded near $-1.0%$ to $-2.0%$.
- In the week prior to the vote, GBP/USD 1-month $RR_{25\Delta}$ plunged to $-11.5%$, with OTM put volatility exceeding 28% while OTM call volatility languished near 16%.
- When the “Leave” outcome was verified, GBP/USD collapsed from 1.5000 to below 1.3200 in overnight trading, vindicating the extreme pricing of the downside volatility skew.
Frequently Asked Questions (FAQ)
Why does the Black-Scholes model fail to predict the volatility smile?
The original Black-Scholes formula is predicated on geometric Brownian motion with constant volatility and log-normally distributed asset prices. In reality, financial markets exhibit two major violations of this assumption: fat tails (leptokurtosis), where extreme price movements occur far more frequently than predicted by a normal distribution, and negative skewness, where markets drop faster and more violently than they rise. The volatility smile and skew are the market’s empirical adjustments to correct for these theoretical limitations.
How do quantitative FX traders use the volatility smile?
In foreign exchange trading, options market makers construct three-dimensional volatility surfaces parameterized by SABR or Heston stochastic volatility models. Traders use the slope of the smile (the risk reversal) to gauge market sentiment and identify directional imbalances. Furthermore, quantitative relative value funds trade the spread between the implied volatility smile and realized path-dependent volatility, capturing mispriced tail risk through delta-neutral strangles and butterflies.
What causes a currency’s volatility skew to flip from negative to positive?
In currency pairs, the sign of the risk reversal reflects which currency is perceived as the dominant safe haven or carry beneficiary. For example, in USD/JPY, the pair typically exhibits a negative skew (downside JPY calls / USD puts are more expensive) because the Japanese Yen is bought during global panics. However, during periods of extreme global monetary divergence—such as 2022 when the Federal Reserve aggressively hiked rates while the Bank of Japan maintained negative interest rates—demand for USD upside calls surged, causing the risk reversal to invert toward a positive skew.
Ready to trade forex?
Open a free demo account with a regulated broker. Practice with virtual funds before risking real money.