Z-Score
A Z-Score is a statistical metric that quantifies the number of standard deviations a given data point lies above or below the mean, widely applied in quantitative trading for mean-reversion modeling and corporate insolvency prediction via the Altman Z-score.
What Is a Z-Score?
In statistics, financial modeling, and quantitative trading, a Z-Score (also known as a standard score) measures the exact distance between an observed data point and the population mean ($\mu$), expressed in units of standard deviation ($\sigma$). A Z-score of zero indicates that the data point is identical to the mean, while positive or negative values quantify how far the observation deviates above or below expected baseline conditions.
In financial markets, the Z-score fulfills two distinct, high-impact institutional functions:
- Quantitative Trading & Market Microstructure: Measures short-term price, spread, or valuation extremes relative to historical moving averages, providing the mathematical trigger for algorithmic mean-reversion strategies and statistical arbitrage (StatArb).
- Corporate Credit Risk Assessment: Formulated by Edward Altman in 1968, the Altman Z-Score combines five key balance-sheet financial ratios into a predictive multivariate score that forecasts corporate bankruptcy and credit default risk.
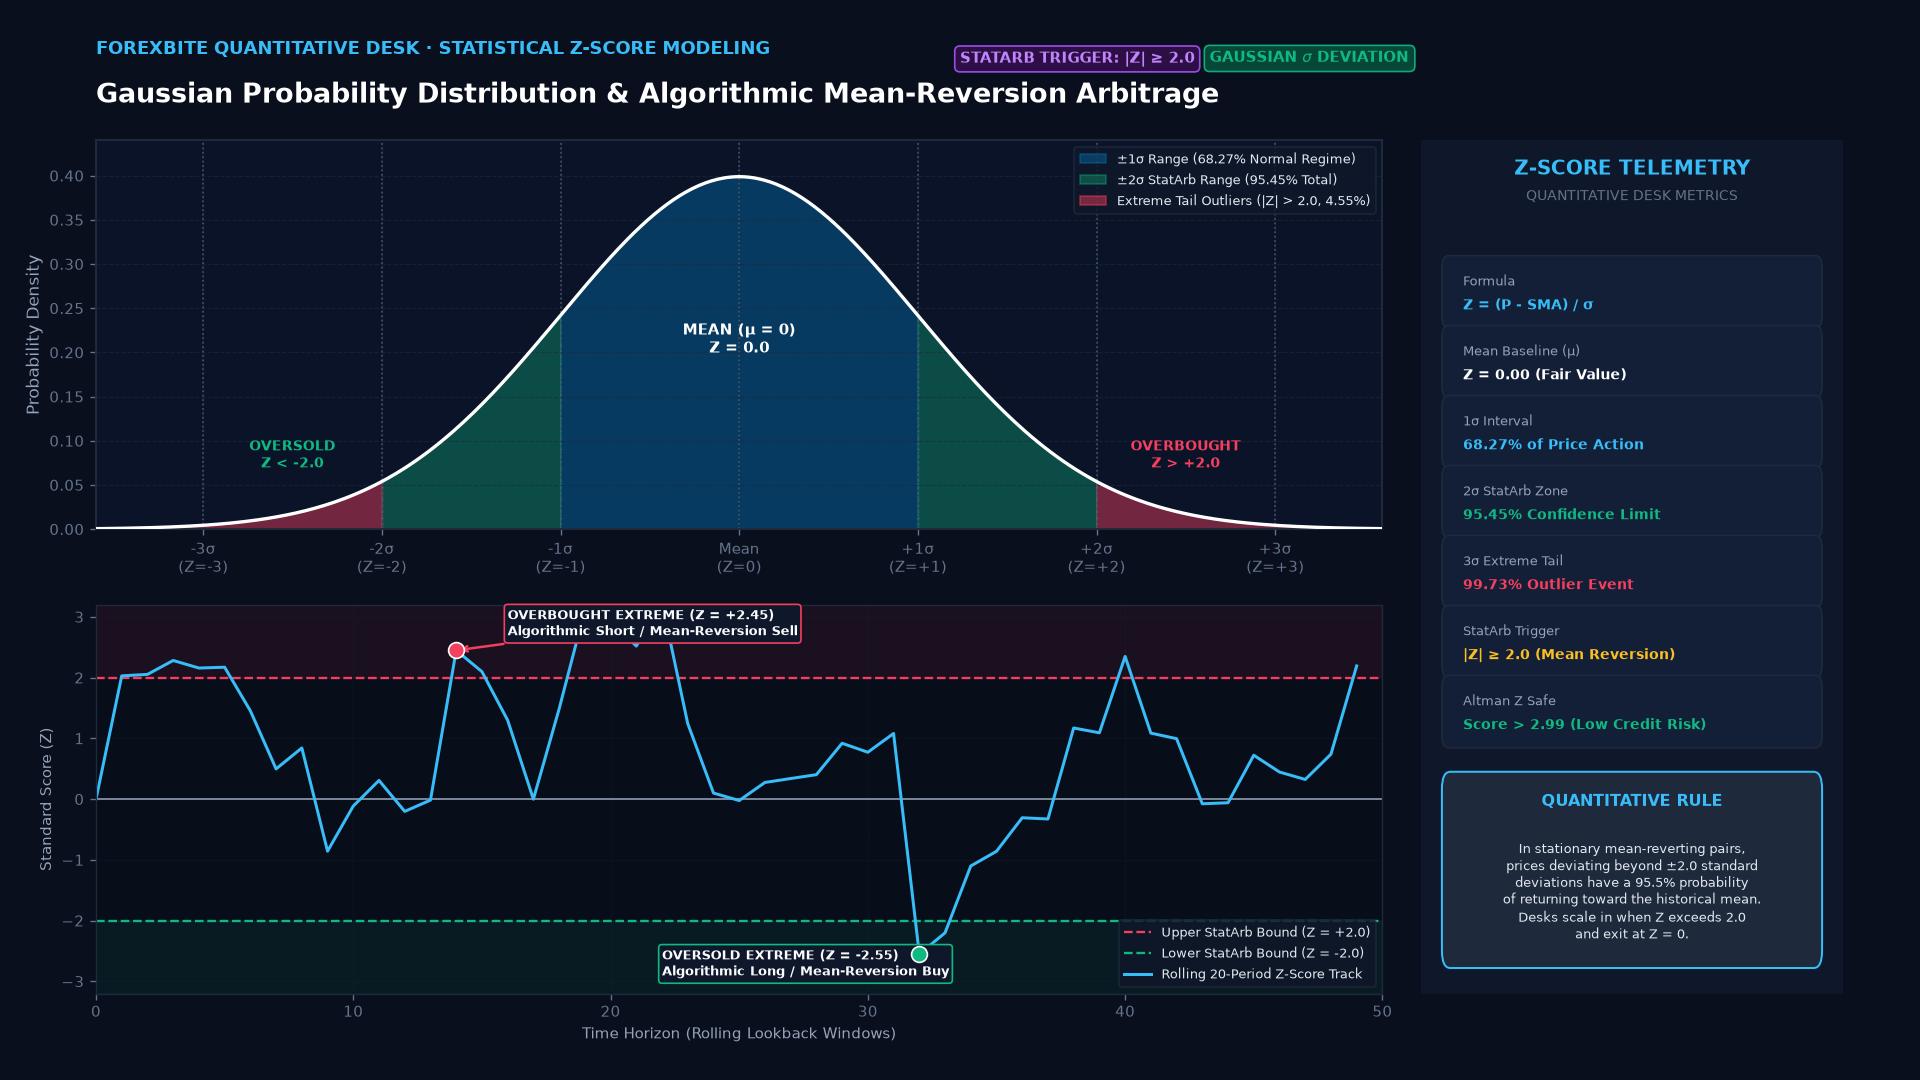 Figure: Statistical Z-Score framework illustrating the Gaussian probability density function ($\pm 1\sigma, \pm 2\sigma, \pm 3\sigma$), confidence intervals, and rolling algorithmic mean-reversion trade triggers.
Technical Formulations: Algorithmic & Credit Models
1. Rolling Statistical Z-Score for Algorithmic Trading
Quantitative trading desks calculate a rolling Z-score over a lookback window of $k$ periods (such as 20 or 50 bars) to identify overbought and oversold price anomalies:
$$Z_t = \frac{P_t - \text{SMA}_k(P_t)}{\sigma_k(P_t)}$$
Where:
- $P_t$: Asset price (or currency pair spread) at time $t$.
- $\text{SMA}k(P_t)$: Simple moving average over lookback window $k$: $$\text{SMA}k(P_t) = \frac{1}{k} \sum{i=0}^{k-1} P{t-i}$$
- $\sigma_k(P_t)$: Rolling sample standard deviation: $$\sigma_k(P_t) = \sqrt{\frac{1}{k-1} \sum_{i=0}^{k-1} \left(P_{t-i} - \text{SMA}_k(P_t)\right)^2}$$
Algorithmic Mean-Reversion Rules:
- If $Z_t \ge +2.0$: Asset trades $2\sigma$ above mean $\to$ Open Short / Sell Position.
- If $Z_t \le -2.0$: Asset trades $2\sigma$ below mean $\to$ Open Long / Buy Position.
- If $|Z_t| \le 0.5$: Asset reverts toward mean $\to$ Take Profit / Close Position.
2. The Altman Z-Score for Insolvency Prediction
For manufacturing and industrial corporations, the traditional Altman Z-Score equation is:
$$Z = 1.2 X_1 + 1.4 X_2 + 3.3 X_3 + 0.6 X_4 + 0.999 X_5$$
Where:
- $X_1 = \frac{\text{Working Capital}}{\text{Total Assets}}$ (Measures short-term balance-sheet liquidity)
- $X_2 = \frac{\text{Retained Earnings}}{\text{Total Assets}}$ (Measures cumulative profitability over time)
- $X_3 = \frac{\text{EBIT}}{\text{Total Assets}}$ (Operating efficiency and asset earning power)
- $X_4 = \frac{\text{Market Value of Equity}}{\text{Total Liabilities}}$ (Leverage cushion against insolvency)
- $X_5 = \frac{\text{Sales}}{\text{Total Assets}}$ (Asset turnover ratio)
Comparative Matrix: Analytical Frameworks
| Metric | Primary Discipline | Output Nature | Key Interpretation Thresholds |
|---|---|---|---|
| Statistical Z-Score | Quantitative / StatArb | Continuous ($\pm \sigma$) | $Z > +2$ (Overbought), $Z < -2$ (Oversold) |
| Altman Z-Score | Fundamental Credit Risk | Absolute number | $>2.99$ (Safe), $1.81 - 2.99$ (Grey), $<1.81$ (Distress) |
| Bollinger Bands %b | Technical Analysis | Normalized ratio ($0.0 - 1.0$) | $%b > 1.0$ (Above Upper Band), $%b < 0.0$ (Below Lower Band) |
| Relative Strength Index (RSI) | Momentum Oscillator | Bounded index ($0 - 100$) | $>70$ (Overbought), $<30$ (Oversold) |
Real-World Case Study: Statistical Arbitrage & Corporate Insolvency
StatArb FX Pairs Trading: EUR/USD vs. GBP/USD
During major geopolitical negotiations (such as the 2018–2019 Brexit debates), European and British currencies exhibited strong cointegration but experienced sharp temporary divergences.
- Quantitative funds tracked the synthetic spread: $S_t = \ln(\text{EUR/USD}_t) - \beta \ln(\text{GBP/USD}_t)$.
- Whenever localized political rumors pushed the spread’s rolling 60-day Z-score beyond $\pm 2.5\sigma$, statistical arbitrage algorithms sold the outperforming currency and bought the lagging currency.
- As political noise faded, the spread reverted to its historical mean ($Z \to 0$), generating market-neutral profits regardless of broad US Dollar direction.
Enron Bankruptcy Warning (2001)
Prior to Enron’s catastrophic collapse in December 2001, credit rating agencies maintained investment-grade ratings on the energy giant’s debt. However, independent forensic analysts tracking Enron’s balance sheet noted that its Altman Z-Score collapsed from 2.85 in 1999 to below 1.20 by mid-2001, flashing a severe distress signal months before the company filed for Chapter 11 bankruptcy.
Frequently Asked Questions (FAQ)
What are the three zones of the Altman Z-Score?
Edward Altman established three distinct empirical zones based on historical corporate bankruptcy outcomes:
- Safe Zone ($Z > 2.99$): The company exhibits robust financial health with negligible probability of insolvency within two years.
- Grey Zone ($1.81 \le Z \le 2.99$): Financial vulnerabilities exist; the firm has a moderate likelihood of credit distress requiring close monitoring.
- Distress Zone ($Z < 1.81$): High probability of corporate bankruptcy within 24 months unless the company undergoes aggressive balance-sheet restructuring.
What are the main limitations of using statistical Z-scores in financial markets?
The primary limitation is the assumption of Gaussian normal distribution. Real-world financial returns exhibit fat tails (excess kurtosis) and negative skewness, meaning that 3-sigma and 4-sigma price moves happen far more frequently than predicted by standard normal distributions. An algorithmic trader relying blindly on a $+2\sigma$ Z-score to short a stock or currency during a structural momentum breakout risks severe losses if the asset enters a multi-week trend instead of reverting to the mean.
How is the Z-score mathematically related to Bollinger Bands?
Bollinger Bands are a direct visual representation of a rolling 2-standard-deviation Z-score. The middle band represents the Simple Moving Average ($\text{SMA}_k$, where $Z = 0$), while the upper and lower bands represent $Z = +2.0$ and $Z = -2.0$ respectively. When an asset’s price touches or pierces the upper Bollinger Band, its statistical Z-score is mathematically equal to or greater than $+2.0$.
Ready to trade forex?
Open a free demo account with a regulated broker. Practice with virtual funds before risking real money.