Zeta Model
A seven-variable credit-scoring model developed by Edward Altman, Robert Haldeman, and P. Narayanan in 1977 to predict the probability of corporate bankruptcy and financial distress for publicly traded firms up to five years in advance.
Zeta Model
The Zeta Model is a second-generation multivariate credit risk assessment framework engineered in 1977 by financial economist Edward I. Altman, Robert G. Haldeman, and P. Narayanan. Developed through Zeta Services Inc., the model was designed to predict corporate bankruptcy and financial distress up to five years prior to default. Building upon Altman’s pioneering 1968 Z-score, the Zeta framework expanded credit scoring beyond capital-intensive manufacturing corporations to encompass retail, transportation, and service enterprises, while updating accounting treatments to reflect modern corporate balance sheet complexities.
In commercial lending, debt capital markets, and distressed credit investing, the Zeta Model established the foundation for modern quantitative credit analysis. By synthesizing balance sheet solvency, operational earnings volatility, and capital structure stability into a single predictive score, institutional analysts distinguish fundamentally resilient balance sheets from deteriorating credits years before rating agencies downgrade debt issues.
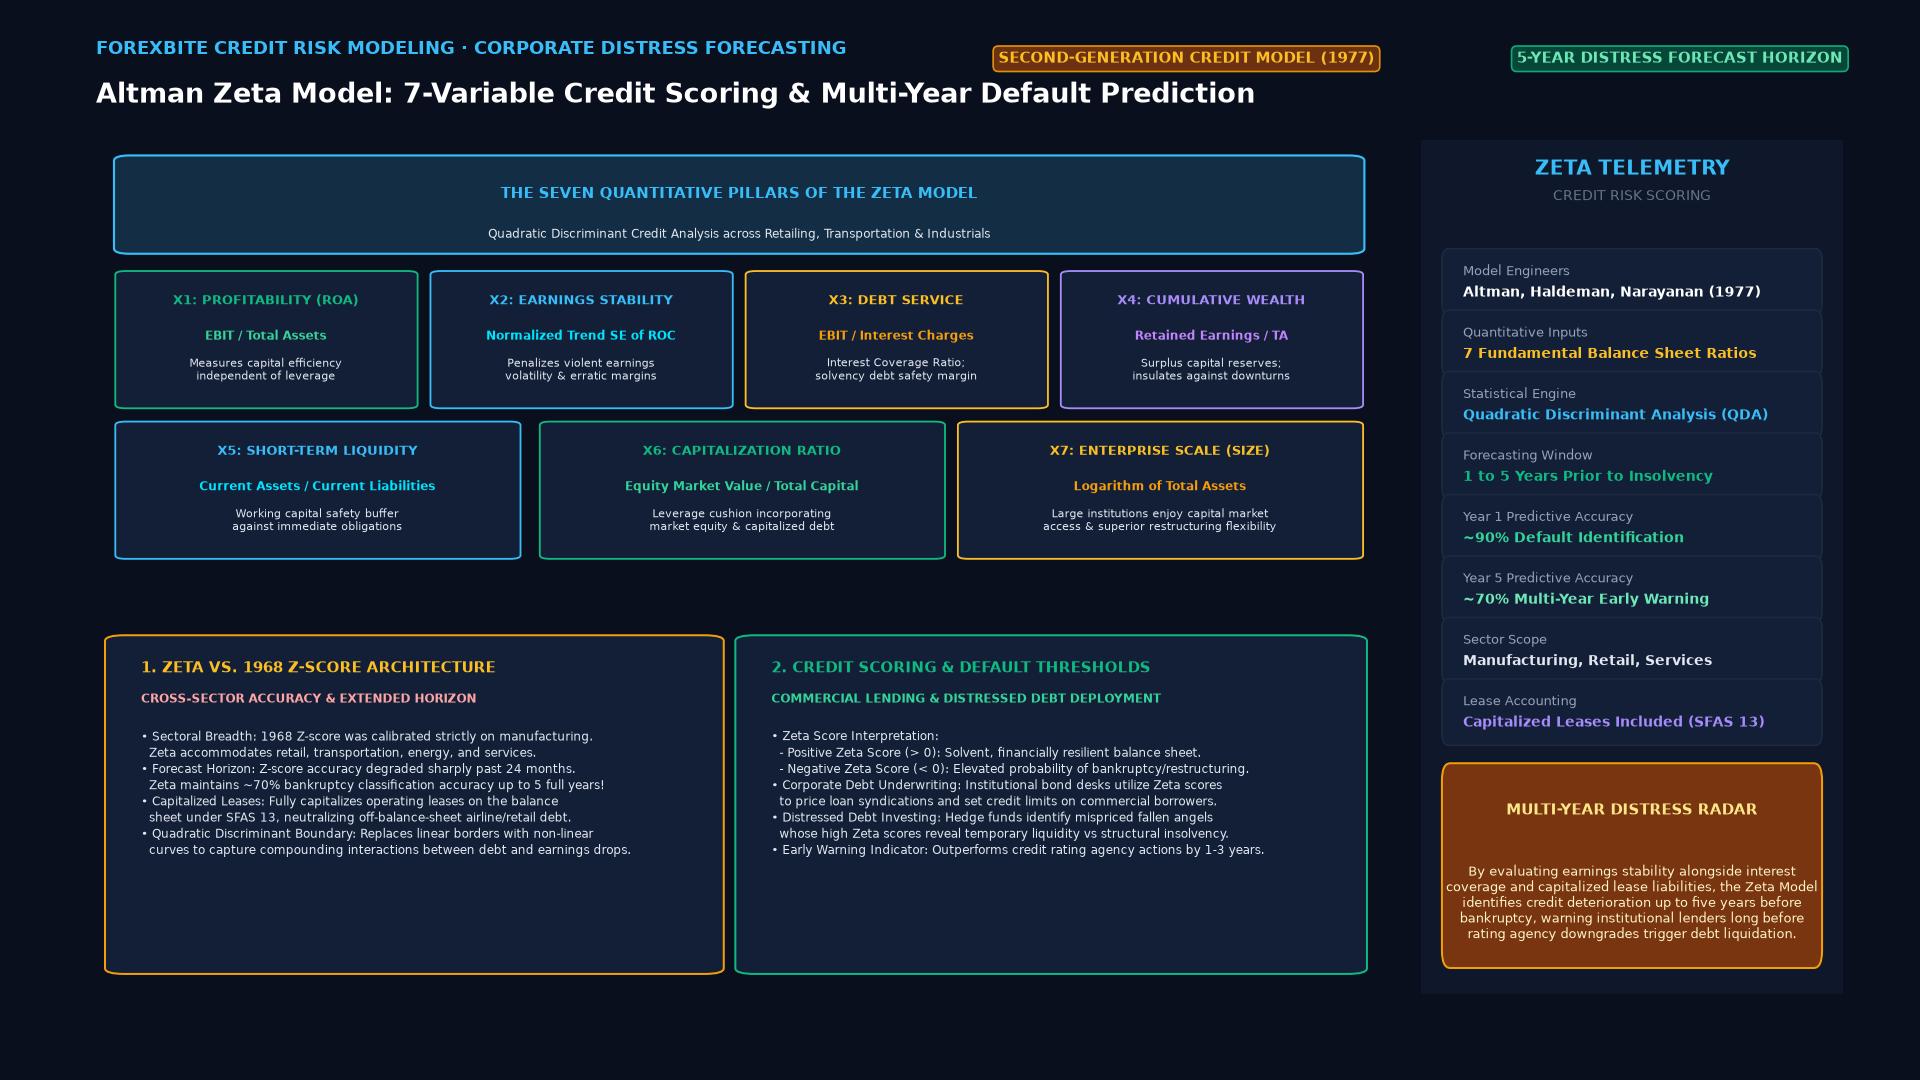 Figure: The seven quantitative pillars of the Altman Zeta Model for multi-year corporate credit distress and bankruptcy forecasting.
Architectural Evolution: Beyond the 1968 Z-Score
While Altman’s original 1968 five-variable Z-score delivered breakthrough predictive accuracy for near-term corporate failures, changing market structures and accounting standards revealed analytical shortcomings during the 1970s:
- Sectoral Concentration: The 1968 model was calibrated exclusively on asset-heavy manufacturing corporations. Applying it to asset-light retailers or transportation carriers generated false distress alerts due to lower tangible fixed-asset ratios.
- Short Forecasting Horizon: The original Z-score achieved 95% accuracy one year prior to bankruptcy, but its predictive power degraded steeply beyond 24 months. Bank loan committees and long-dated bond underwriters required a multi-year lead time to restructure credit exposure.
- Accounting Distortions: During the 1970s, corporations increasingly utilized off-balance-sheet financing, notably operating leases for airline fleets and retail storefronts. The enactment of Statement of Financial Accounting Standards No. 13 (SFAS 13) mandated lease capitalization. The Zeta Model integrated these adjustments directly into asset and liability calculations.
- Non-Linear Relationships: Financial ratios rarely interact in perfectly straight lines. Extreme earnings volatility or severe interest coverage shortfalls compound default risk geometrically rather than additively. The Zeta Model accommodated non-linear interactions through advanced discriminant techniques.
The Seven Quantitative Variables of the Zeta Model
The Zeta Model derives an overall score by evaluating seven financial variables spanning profitability, cash flow stability, debt coverage, and company scale:
+--------------------------------------------------------------------------+
|                  The Seven Pillars of the Zeta Model                     |
+--------------------------------------------------------------------------+
|  Variable | Metric Category      | Operational Definition                |
+-----------+----------------------+---------------------------------------+
|  X_1      | Profitability        | EBIT / Total Assets                   |
|  X_2      | Earnings Stability   | Normalized Trend SE of Operating ROC  |
|  X_3      | Debt Service Capacity| EBIT / Total Interest Charges         |
|  X_4      | Cumulative Wealth    | Retained Earnings / Total Assets      |
|  X_5      | Short-Term Liquidity | Current Assets / Current Liabilities   |
|  X_6      | Capitalization       | 5-Year Equity MV / Total Capital      |
|  X_7      | Firm Scale           | Natural Log of Total Tangible Assets  |
+--------------------------------------------------------------------------+
1. Return on Assets ($X_1 = \text{EBIT} / \text{Total Assets}$)
This variable assesses the core operational earning power of the firm’s assets unclouded by tax structures or financial leverage. High asset productivity generates internal cash buffers against economic contractions.
2. Stability of Earnings ($X_2 = \sigma_{\text{trend}}$)
Earnings stability is measured as the standard error of estimate around a normalized 5-to-10-year trend of earnings returns on capital. Firms with volatile, cyclical operating cash flows face higher default risk at any given debt ratio than stable cash generators like consumer staples or utilities.
3. Debt Service Coverage ($X_3 = \text{EBIT} / \text{Total Interest Charges}$)
This metric measures the cushion between operational profit and contractual debt service burdens. Unlike the 1968 Z-score, which lacked an explicit interest coverage ratio, the Zeta Model treats interest coverage as a central pillar of solvency, incorporating capitalized lease interest obligations into total debt charges.
4. Cumulative Profitability ($X_4 = \text{Retained Earnings} / \text{Total Assets}$)
Retained earnings represent the cumulative reinvestment of past profits over the lifetime of the enterprise. Mature, profitable businesses finance growth through retained earnings, demonstrating long-term resilience. Young or structurally unprofitable companies exhibit low or negative ratios, leaving them vulnerable to external liquidity freezes.
5. Liquidity ($X_5 = \text{Current Assets} / \text{Current Liabilities}$)
The classical current ratio reflects short-term liquidity cushions. Although Altman observed that liquidity ratios were less predictive than profitability metrics, maintaining sufficient working capital prevents immediate operational paralysis when trade credit tightens.
6. Capitalization ($X_6 = \text{Market Value of Equity} / \text{Total Capital}$)
Calculated using a multi-year average of the firm’s equity market value divided by total capital (equity plus long-term debt and capitalized lease commitments). The multi-year smoothing prevents temporary equity market bubbles or market selloffs from misrepresenting the firm’s underlying financial leverage.
7. Firm Size ($X_7 = \ln(\text{Total Assets})$)
Calculated as the natural logarithm of total corporate assets (adjusted for inflation). Empirical research confirms that large multinational corporations fail far less frequently than micro-cap enterprises with identical leverage ratios, due to superior banking access, diversified revenue channels, and sovereign support considerations.
Statistical Formulation: Discriminant Analysis Mechanics
The Zeta Model processes these seven inputs through multivariate discriminant analysis (MDA):
$$ZETA = \beta_0 + \beta_1 X_1 + \beta_2 X_2 + \beta_3 X_3 + \beta_4 X_4 + \beta_5 X_5 + \beta_6 X_6 + \beta_7 X_7$$
Where:
- $\beta_0$ represents the intercept constant.
- $\beta_1$ through $\beta_7$ represent the empirical discriminant weights calibrated against matched samples of bankrupt and healthy companies.
       Distribution of Healthy vs. Distressed Corporate Zeta Scores
  Frequency
     ^
     |         Bankrupt Firms                    Healthy Firms
     |             (Mean ~ -2.0)                 (Mean ~ +3.5)
     |                ***                            ***
     |              *******                        *******
     |             *********                      *********
     |            ***********                    ***********
     |           *************                  *************
     |          ***************                ***************
     +-----------------|------------------------------|------------->
                     -2.0             0.0           +3.5     Zeta Score
                                       ^
                                 Cutoff Boundary
Classification Thresholds
- ZETA > +0.0: Indicates healthy credit profile with low default probability over the medium term.
- ZETA < 0.0: Indicates severe financial distress, signaling high probability of bankruptcy or corporate reorganization within 12 to 36 months.
- Gray Zone (-0.5 to +0.5): Requires detailed qualitative evaluation of management quality, asset liquidity, and covenant flexibility.
Comparative Credit Modeling Taxonomy
Credit analysts position the Zeta Model across a spectrum of classical and modern default prediction methodologies:
| Model Paradigm | Methodology | Key Advantages | Primary Limitations |
|---|---|---|---|
| Altman Z-Score (1968) | Linear Discriminant Analysis on 5 financial ratios | Simple formula, publicly available coefficients, zero market data required | Calibrated only for manufacturing, short horizon (1-2 years), misses capitalized leases |
| Zeta Model (1977) | Multivariate discriminant analysis on 7 variables | High 5-year accuracy (~70%), handles non-manufacturing and capitalized leases | Proprietary coefficient weights, requires historical earnings stability data |
| Merton Structural Model (1974) | Black-Scholes option pricing applied to corporate capital structure | Real-time equity market calibration, forward-looking market volatility | Assumes simple capital structure, sensitive to short-term equity market noise |
| Machine Learning (XGBoost/LightGBM) | Non-linear ensemble trees on hundreds of features | Captures complex cross-sectional interactions and alternative datasets | Black-box opacity, high regulatory scrutiny in bank loan approvals |
Practical Applications in Debt Markets
[ Financial Statement Data & Multi-Year Equity Pricing ]
                          │
                          ▼
[ Balance Sheet Restructuring: Capitalize Leases & Off-Balance Debt ]
                          │
                          ▼
[ Extract Seven Zeta Ratios: X1 (ROA) to X7 (Log Assets) ]
                          │
                          ▼
[ Compute Zeta Output Score ]
                          │
         ┌────────────────┴────────────────┐
         ▼                                 ▼
   [ Score < 0.0 ]                   [ Score > 0.0 ]
  Distressed Credit                   Healthy Credit
  - Raise Lending Margin             - Approve Credit Facility
  - Demand Senior Collateral         - Tighten Bond Yield Spreads
  - Execute Credit Default Hedge     - Extend Loan Maturity Tenors
1. Commercial Bank Syndicated Lending
Commercial loan underwriting teams mandate minimum Zeta thresholds when pricing revolving credit facilities. A borrower whose score drops from +2.5 to +0.2 triggers mandatory covenant reviews, tighter working capital restrictions, or requests for pledged collateral.
2. High-Yield Bond Portfolio Surveillance
Asset managers holding high-yield corporate bonds deploy Zeta surveillance to anticipate rating downgrades. Because rating agencies often delay downgrading blue-chip issuers until distress is undeniable, quantitative Zeta declines give credit portfolio managers an early window to exit positions before liquidity evaporates.
3. Distressed Debt and Turnaround Private Equity
Distressed debt funds analyze companies with negative Zeta scores to identify firms whose distress stems from excessive debt service ($X_3$ and $X_6$) rather than broken operating engines ($X_1$). If Return on Assets remains fundamentally sound, a balance sheet debt-for-equity swap can quickly restore solvency.
Limitations and Practical Blind Spots
Despite its empirical strength, relying solely on the Zeta Model introduces distinct analytical hazards:
- Reliance on Historical Financial Statements: Like all accounting-based frameworks, the Zeta Model depends on backward-looking reporting. In dynamic, fast-deteriorating environments, quarterly reports arrive weeks after cash burn has accelerated.
- Vulnerability to Financial Engineering: Aggressive revenue recognition, off-balance vendor financing, and supply-chain factoring can artificially enhance working capital ratios ($X_5$) and reported EBIT ($X_1$) until liquidity suddenly collapses.
- Market Liquidity Disconnect: The model assesses creditworthiness but ignores market liquidity. A moderately distressed corporate borrower may survive if sovereign central banks unleash quantitative easing, while a viable mid-market firm with an acceptable Zeta score may fail during sudden interbank credit freezes.
Frequently Asked Questions
Why are the exact coefficients of the Zeta Model proprietary?
Unlike the 1968 Z-score, which Altman published openly in the Journal of Finance, the Zeta Model was developed in collaboration with commercial partners and commercialized through Zeta Services Inc. The proprietary coefficients were licensed directly to institutional subscribers, rating agencies, and financial institutions.
How does the Zeta Model adjust for operating leases?
Prior to modern IFRS 16 and ASC 842 lease standards, companies classified major commitments as operating leases, hiding large liabilities from balance sheets. The Zeta Model capitalized future lease commitments using discounted present value techniques, adding the resulting obligations to total debt and incorporating implicit lease interest into total debt charges.
Can the Zeta Model evaluate financial institutions or sovereign nations?
No. Commercial banks, insurers, and financial firms maintain capital structures dominated by customer deposits, policy reserves, and regulatory reserves, which invalidate standard industrial working capital and asset turnover ratios. Sovereign entities possess taxation and monetary issuance powers that require macroeconomic debt-sustainability models rather than corporate bankruptcy metrics.
Ready to trade forex?
Open a free demo account with a regulated broker. Practice with virtual funds before risking real money.