Activity Level
Activity Level describes the structural tier of an operational task within the ABC cost hierarchy (unit, batch, product, customer, or facility level), as well as the overall operational volume and capacity utilization of an enterprise.
What Is Activity Level?
In managerial accounting, operations research, and capacity planning, the term Activity Level operates across two related dimensions:
- The Cost Hierarchy Tier (ABC Framework): In Activity-Based Costing, activity level describes where a specific task sits within the structural hierarchy of cost causation. It defines how elastic or sensitive an activity is to changes in product volume, batch frequency, product diversity, or customer customization.
- Operational Capacity Utilization: In industrial operations and financial analysis, activity level refers to the actual volume or rate of operational output generated by a plant, division, or machine during a given period (often expressed as a percentage of total practical capacity or standard machine hours).
Understanding activity levels is essential for accurate cost allocation. When managers mistakenly assume that all organizational costs vary in direct linear proportion to unit volume, they make catastrophic pricing and budgeting errors.
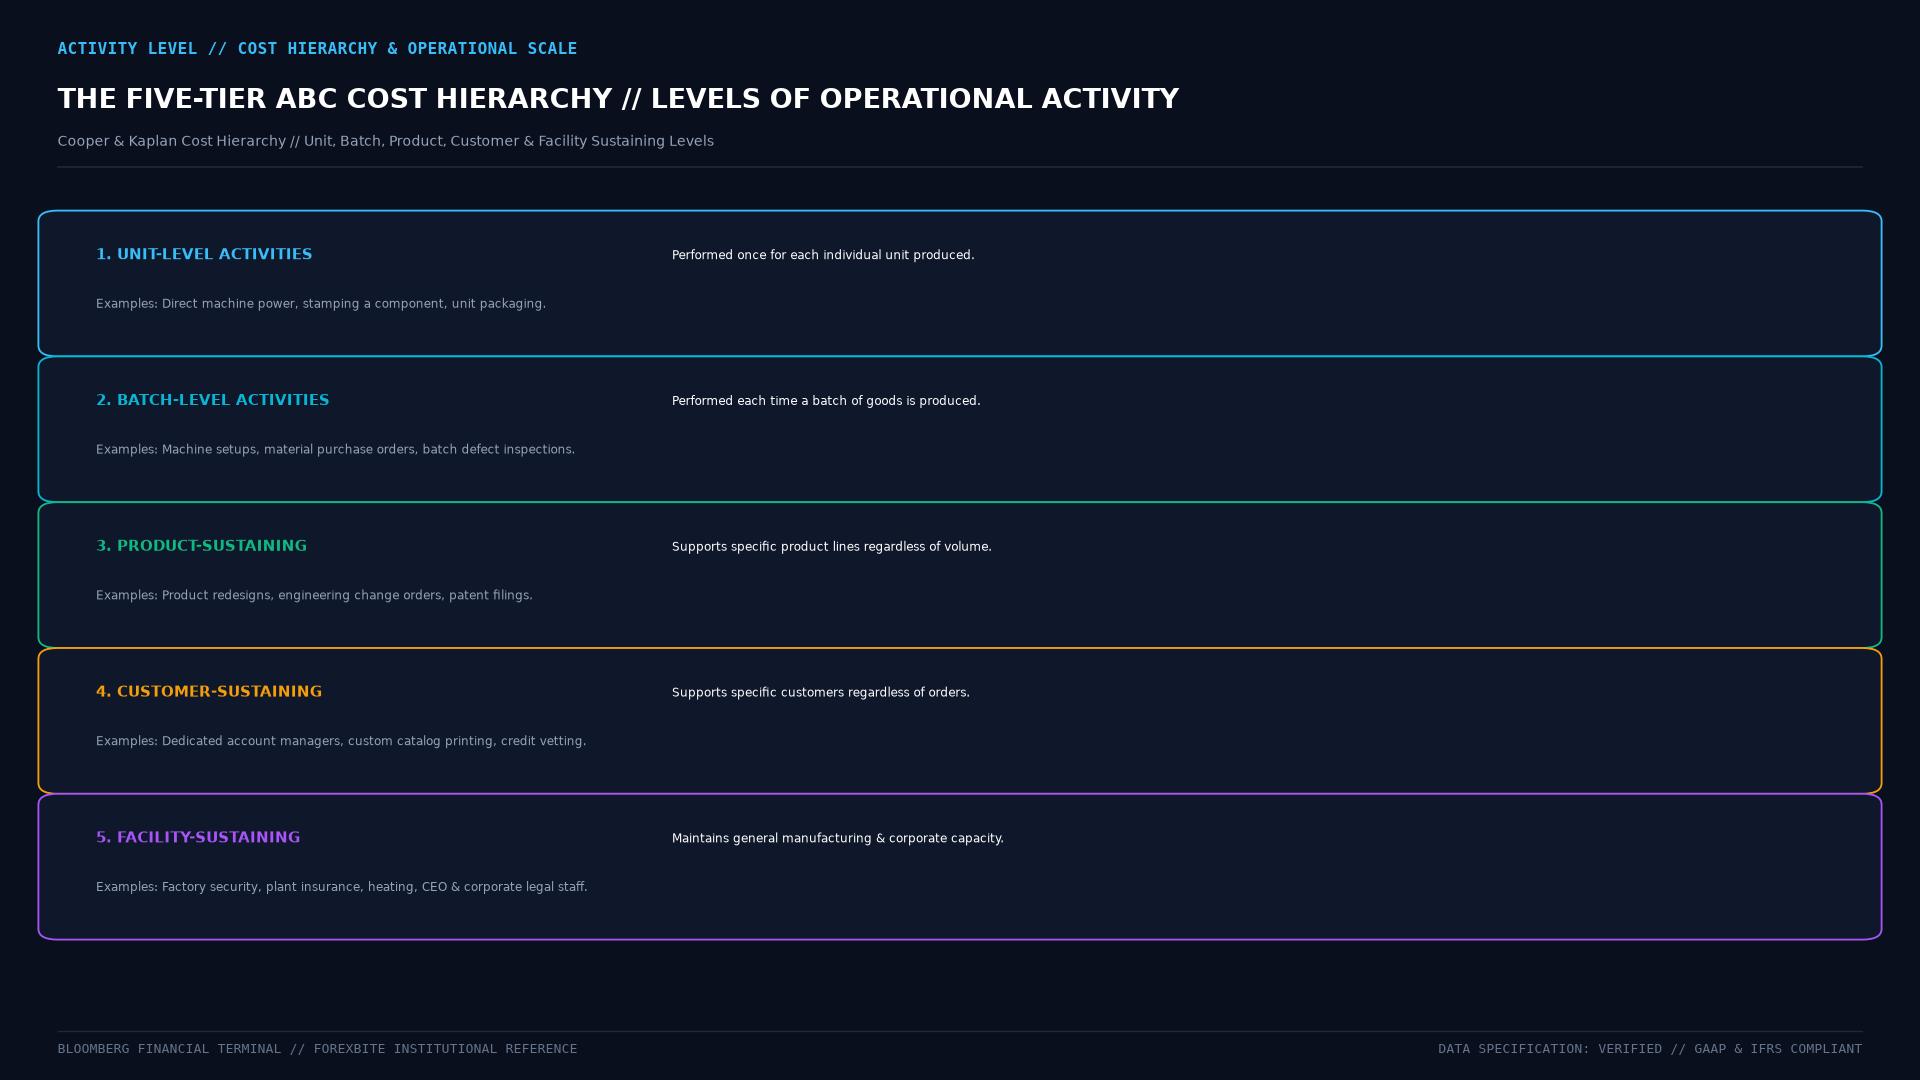 Figure: Operational cost behavior across the relevant range demonstrating Fixed Costs, Variable Costs, and Semi-Variable (Mixed) step costs as activity levels fluctuate.
Technical Mechanics: The Five Activity Hierarchy Levels
Activity-Based Costing groups operational tasks into five distinct tiers based on cost behavior:
1. Unit-Level Activities
Performed each time an individual unit of a product is manufactured or a single transaction is executed:
- Cost Behavior: Strictly variable. Total cost increases in direct linear proportion to the number of units produced.
- Examples: Cutting fabric for an individual garment, machine runtime electricity per stamped part, injecting plastic into a mold.
2. Batch-Level Activities
Performed each time a group, batch, or production run of goods is processed, regardless of how many individual units are contained within the batch:
- Cost Behavior: Fixed relative to the number of units in the batch, but variable relative to the number of batches executed. A setup required for a batch of 50 units consumes the identical time as a setup for a batch of 5,000 units.
- Examples: Calibrating CNC machine tooling, moving a forklift pallet of components, printing production work orders.
3. Product-Sustaining Activities
Performed to support an entire product line or service offering, regardless of the number of batches or units produced:
- Cost Behavior: Scales with product diversity and complexity rather than unit volume.
- Examples: Designing packaging artwork, conducting regulatory environmental compliance tests for a chemical line, issuing engineering change notices (ECNs).
4. Customer-Sustaining Activities
Performed to support individual commercial customers, regardless of which specific products they purchase:
- Cost Behavior: Driven by customer relationship management demands.
- Examples: Providing customized EDI electronic billing portals, entertaining purchasing managers, conducting annual client inventory audits.
5. Facility-Sustaining (Organizational) Activities
Infrastructure activities that maintain the general production facility and organizational operations:
- Cost Behavior: Completely fixed and non-traceable to individual products or customers.
- Examples: Factory building rent, general plant lighting and heating, plant manager salary, grounds maintenance, corporate liability insurance.
Operational Capacity Activity Levels
In financial modeling and cost-volume-profit (CVP) analysis, corporate financial analysts evaluate activity levels against four standardized operational capacity benchmarks:
| Capacity Benchmark | Definition & Mechanics | Application in Planning |
|---|---|---|
| Theoretical (Maximum) Capacity | 100% capacity operating 24/7/365 with zero downtime or breaks | Engineering benchmark; unattainable in reality |
| Practical Capacity | Real-world capacity adjusted for planned maintenance, breaks, and shifts | The mandatory benchmark for calculating ABC driver rates |
| Normal (Budgeted) Capacity | Average commercial output expected across multi-year business cycles | Used for long-term strategic pricing and capital budgets |
| Current Expected Capacity | Anticipated output volume scheduled for the immediate upcoming fiscal year | Used for annual operational staffing and material procurement |
Comparative Matrix: Cost Behavior Across Activity Levels
| Activity Level | Primary Cost Trigger | Impact of Doubling Unit Volume (Batch Size Fixed) | Impact of Doubling Batch Count |
|---|---|---|---|
| Unit-Level | Number of physical units | Doubles total unit cost pool | Zero direct impact on unit cost pool |
| Batch-Level | Number of production runs | Zero direct impact (same batch count) | Doubles total batch setup cost pool |
| Product-Level | Number of discrete SKUs | Zero impact | Zero impact |
| Facility-Level | Factory physical existence | Zero impact | Zero impact |
Real-World Case Study: Injection Molding Batch Level Distortions
In 2024, a custom plastics injection molding plant produced two product lines on identical machines:
- Product Alpha (Standard Auto Clips): 1,000,000 units produced in 10 large batches of 100,000 units.
- Product Beta (Specialized Surgical Clamps): 10,000 units produced in 100 small custom batches of 100 units.
Under traditional volume costing, the plant allocated all machine setup overhead ($660,000 total setup budget across 110 total setups, averaging $6,000 per setup) based on unit volume ($0.653 per unit).
Product Alpha was charged $653,000 in setup overhead, while Product Beta was charged only $6,530.
When the company mapped activity levels:
- Product Alpha consumed only 10 setups = $60,000 in true batch activity cost ($0.06 per unit!).
- Product Beta consumed 100 setups = $600,000 in true batch activity cost ($60.00 per unit!).
The activity level analysis revealed that Product Beta was generating a net loss of $48 per unit under existing contract pricing. Management restructured pricing to include a mandatory $5,000 batch setup fee, preventing low-volume orders from eroding plant operating margins.
Frequently Asked Questions (FAQ)
Why should facility-sustaining costs not be arbitrarily assigned to unit products?
Facility-sustaining costs (like corporate headquarters rent or plant security) have no cause-and-effect relationship with individual product manufacturing. Arbitrarily allocating these costs across unit volumes distorts product margins and can cause management to discontinue profitable products that contribute positively to covering enterprise overhead.
How does identifying activity levels support Lean manufacturing?
Lean manufacturing focuses heavily on reducing batch-level waste. By targeting batch-level activity drivers, such as reducing setup times through Single-Minute Exchange of Die (SMED) techniques, companies can run smaller batch sizes without increasing unit costs, reducing warehouse inventory holding costs.
What is the break-even activity level?
The break-even activity level is the specific volume of operational output (measured in units or sales dollars) where total revenues exactly equal total fixed and variable costs, resulting in zero operating profit and zero operating loss.
Ready to trade forex?
Open a free demo account with a regulated broker. Practice with virtual funds before risking real money.