Bar Graph (Bar Chart)
A bar chart in forex is a price chart that displays price action using vertical bars, where each bar represents a specific time period (minute, hour, day, week). Each bar shows four data points: the open price, close price, high, and low of the period. Bar charts are one of the three most common chart types in technical analysis, alongside line charts and candlestick charts.
The Anatomy of a Bar
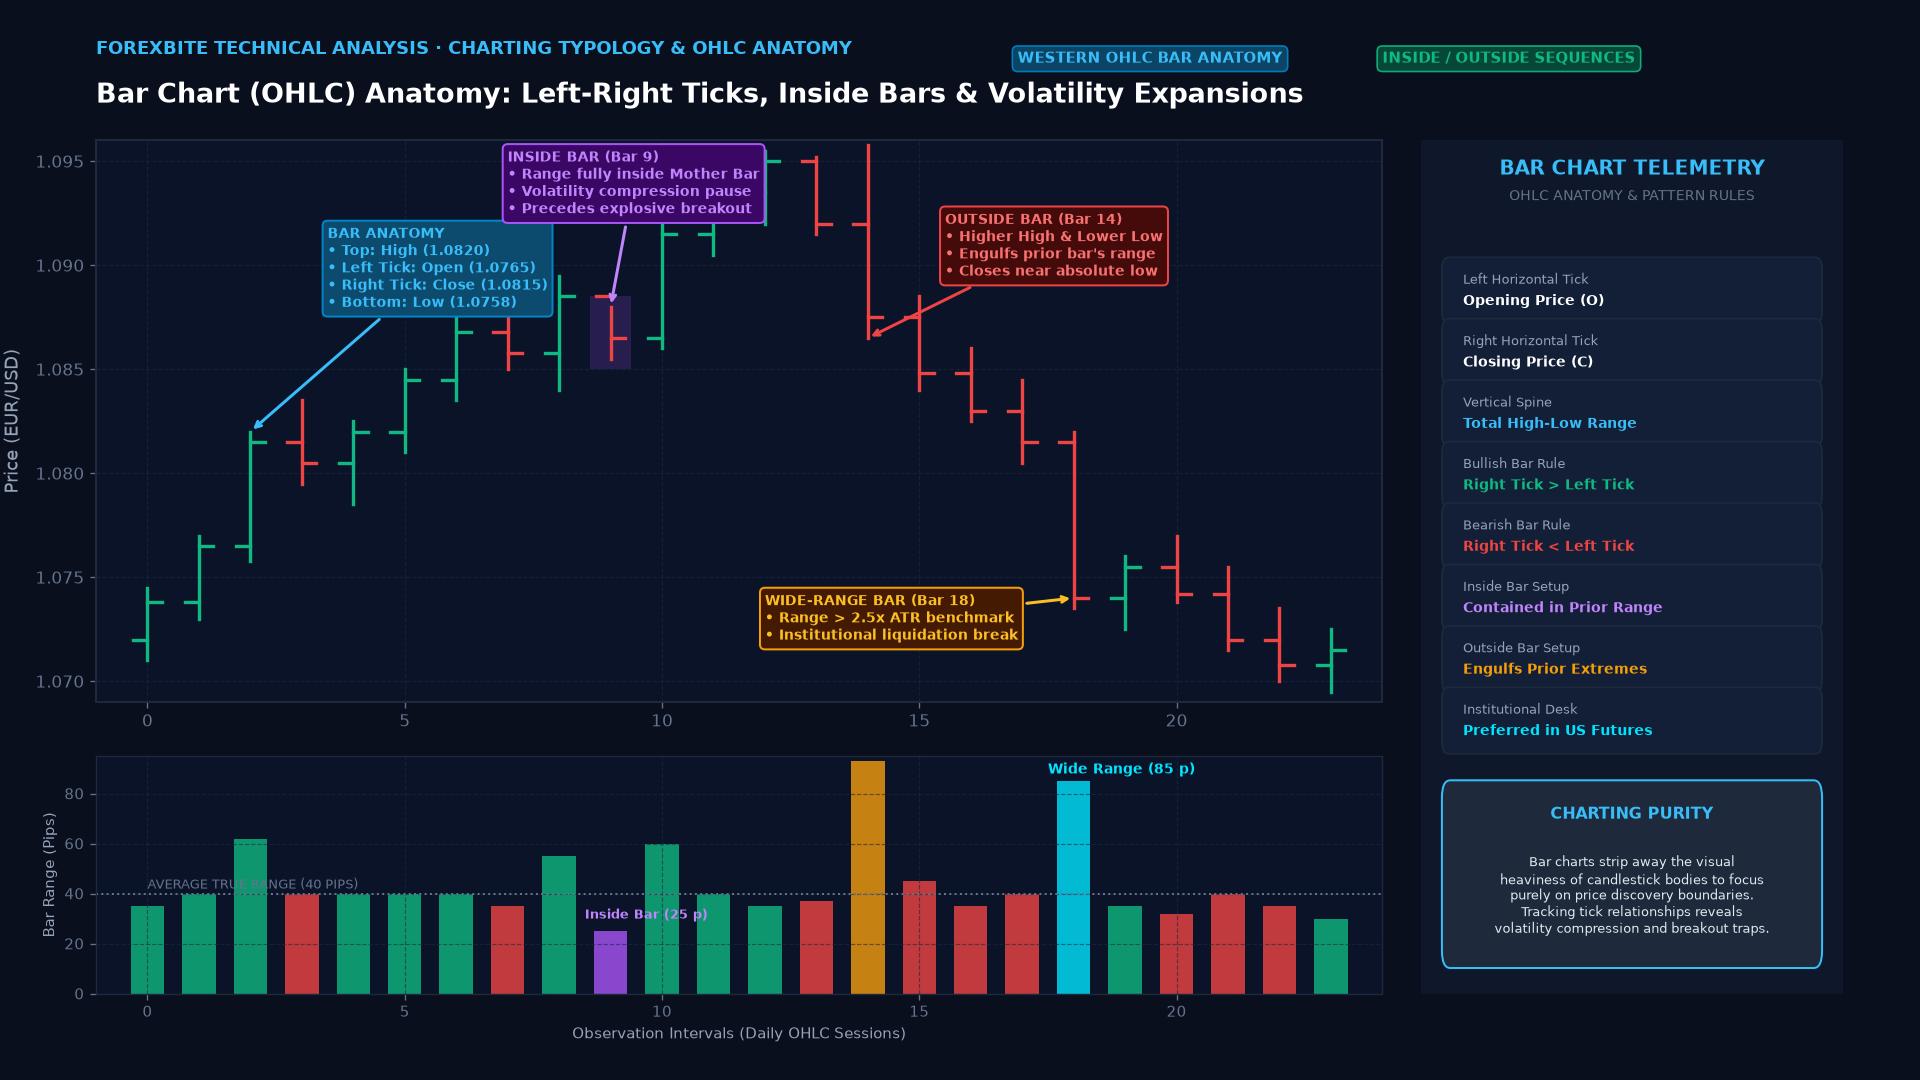
Each bar on a bar chart encodes four pieces of information about the period’s price action:
The vertical line: Spans from the period’s low (bottom) to the period’s high (top). This represents the full range of prices traded during that period.
The left tick: A small horizontal line extending to the left of the vertical bar, indicating the opening price.
The right tick: A small horizontal line extending to the right, indicating the closing price.
Reading a bar:
- If the right tick (close) is higher than the left tick (open): the period closed higher than it opened — a net bullish period
- If the right tick is lower: closed lower than opened — net bearish period
- The distance between left and right tick: the period’s price change
Bar Charts vs. Candlestick Charts
Both display the same four data points (OHLC). The difference is purely visual:
| Feature | Bar Chart | Candlestick Chart |
|---|---|---|
| Body representation | Space between ticks (no filled body) | Solid/hollow rectangle between open and close |
| Wicks | Same vertical line | Same visual concept (wicks/shadows) |
| Color | Usually monochrome bars | Green/red (or white/black) bodies |
| Information conveyed | Identical OHLC | Identical OHLC |
| Visual intuitiveness | Less intuitive for beginners | More visually immediate — body size and color instantly show direction |
Candlestick charts have largely replaced bar charts in retail trading because the filled body makes direction and momentum immediately apparent. At a glance, a candlestick chart shows a clear visual story — large green candles in an uptrend, large red candles in a downtrend, small bodies indicating indecision.
That said, bar charts remain the preference of some professional traders, particularly in futures markets and among older systematic traders who began before candlesticks became universal in Western markets.
Reading a Sequence of Bars
Individual bars gain meaning in context of the surrounding sequence:
A series of bars with closes near the high: Bullish momentum — buyers are consistently dominating into the close, the market’s most significant price of the day.
A series of bars with closes near the low: Bearish momentum — sellers dominate, each close below the midpoint signals ongoing selling pressure.
Wide-range bars (tall vertical lines): High volatility — significant intraday moves. Wide-range bars at key levels (support, resistance, trend line) are potential reversal signals.
Narrow-range bars (short vertical lines): Low volatility, consolidation. Narrow-range bar clusters often precede breakouts (similar to the Bollinger Band squeeze concept).
Outside bars: A bar with a higher high AND a lower low than the preceding bar — engulfs the previous bar’s range. A form of volatility expansion that can signal reversal.
Inside bars: A bar with a lower high AND a higher low than the preceding bar — contained entirely within the prior bar’s range. Consolidation signal; a breakout from the inside bar often initiates the next directional move.
Bar Chart Timeframes
Like all chart types, bar charts can display any timeframe. The right timeframe depends on your trading style:
- 1-minute and 5-minute bars: Day traders and scalpers tracking intraday moves
- 15-minute and 1-hour bars: Intraday swing positions
- 4-hour and daily bars: Swing traders tracking multi-day moves (the most widely used for active retail forex trading)
- Weekly bars: Position traders and investors tracking long-term trends
Many traders use multiple timeframes simultaneously: daily bars for trend direction, 4-hour bars for swing entry points, and 1-hour or 30-minute bars for precise entry timing.
Key Takeaways
- Bar charts display OHLC (open, high, low, close) data per period as vertical bars with left (open) and right (close) ticks
- Identical information to candlestick charts; candlesticks are more visually intuitive and more widely used in retail forex
- Bullish period: close tick above open tick; bearish: close below open
- Key bar patterns: outside bars (volatility expansion), inside bars (consolidation before breakout), closes near high/low (momentum direction)
- Choice of timeframe should match trading style: 4H/daily for swing traders, 1M/5M for scalpers
FAQ
Why do some traders prefer bar charts over candlestick charts? Primarily habit and heritage. Professional traders who learned on bar charts in the 1980s-1990s often continue using them. Some argue that bar charts are less visually “noisy” — with less color and shape variation, they feel the underlying price structure is cleaner. It’s largely personal preference since the underlying data is identical.
Are there patterns unique to bar charts that don’t apply to candlestick charts? Not meaningfully — inside bars and outside bars have direct candlestick equivalents (inside candles and engulfing candles). The patterns are the same; only the visual encoding differs.
Ready to trade forex?
Open a free demo account with a regulated broker. Practice with virtual funds before risking real money.