Coincident Indicator
A coincident indicator is an economic metric that changes simultaneously with the broader business cycle, providing real-time verification of the economy's current state. Key examples include real GDP, industrial production, retail sales, and aggregate employment.
What Is a Coincident Indicator?
A coincident indicator is an economic metric that fluctuates in direct tandem with the aggregate economic cycle, changing at approximately the exact same time as shifts occur in overall economic activity. Unlike leading indicators (which anticipate future trends before they unfold) or lagging indicators (which validate shifts months after they take place), coincident indicators depict the current condition of the economy as it happens.
In macroeconomic analysis, national statistical bureaus, central banks, and the National Bureau of Economic Research (NBER) rely heavily on coincident indicators to identify economic turning points—specifically dating the formal start and end points of recessions and expansions.
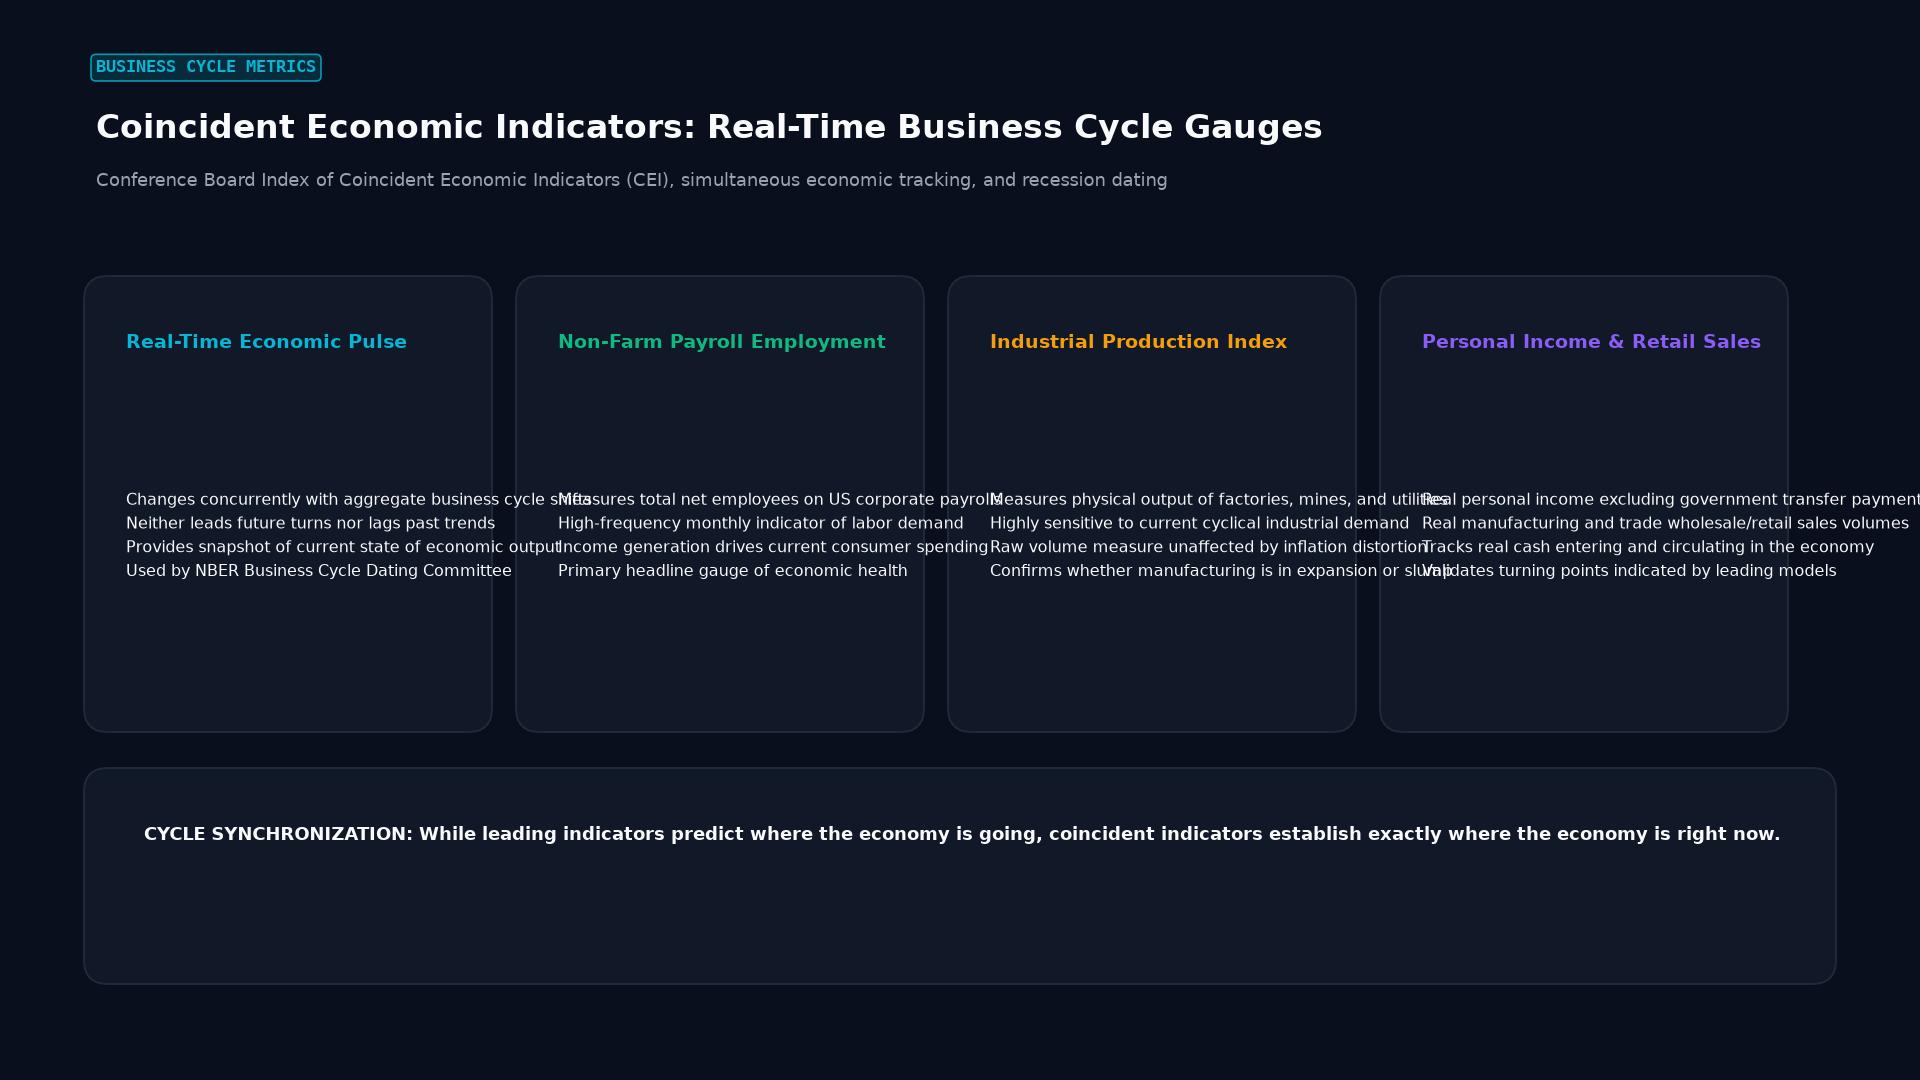 Figure: Conference Board Index of Coincident Economic Indicators (CEI), simultaneous economic tracking, and recession dating
Key Takeaways
- Real-Time Economic Pulse: Coincident data provides market participants with verifiable evidence of whether an economy is currently expanding, stagnating, or contracting.
- The Core Four Metrics: The NBER primarily references four coincident indicators to officially date business cycle peaks and troughs: non-farm payroll employment, real personal income less transfer payments, industrial production, and real manufacturing and trade sales.
- Central Bank Monetary Reaction: Central bankers use coincident data to gauge immediate inflationary pressures and capacity slack, calibrating policy rates (hiking into overheating conditions or cutting during sudden decelerations).
- Forex Market Impact: High-frequency coincident prints (such as U.S. Non-Farm Payrolls or Monthly Retail Sales) trigger violent short-term currency volatility as algorithms reassess interest rate differentials.
The Primary Coincident Indicators in Macroeconomics
The Conference Board publishes a composite Index of Coincident Economic Indicators (CEI) comprising four foundational components. Each provides a distinct perspective on macroeconomic health:
| Metric | Primary Agency | Economic Insight | Forex Market Implication |
|---|---|---|---|
| Gross Domestic Product (GDP) | Bureau of Economic Analysis (BEA) | Broadest measure of total economic output across goods and services | Strong real GDP beats support sovereign currency yield expectations |
| Employees on Non-Agricultural Payrolls (NFP) | Bureau of Labor Statistics (BLS) | Immediate snapshot of labor market creation and employment strength | Major monthly catalyst; drives aggressive repricing across USD pairs |
| Industrial Production & Capacity Utilization | Federal Reserve Board (G.17) | Physical output of factories, mines, and utilities | Gauges industrial health and supply-side capacity constraints |
| Real Personal Income Excluding Transfers | Bureau of Economic Analysis (BEA) | Organic purchasing power generated by wages and salaries | Higher earned wages directly support consumer spending resilience |
| Real Manufacturing and Wholesale Sales | U.S. Census Bureau | Business-to-business demand and commercial supply chain volume | Declining sales signal immediate inventory overhangs |
How Forex Traders Leverage Coincident Data
Foreign exchange pricing is fundamentally rooted in relative economic momentum and interest rate expectations. When central banks set benchmark policy rates, they look to coincident indicators to verify whether theoretical forecasts from leading indicators are translating into reality.
1. The Expectation vs. Actual Differential
Traders do not trade coincident metrics in a vacuum; they trade the variance between consensus forecast and the reported figure: $$\Delta_{\text{surprise}} = \text{Actual Release} - \text{Consensus Estimate}$$
- If a coincident indicator significantly outperforms consensus ($\Delta_{\text{surprise}} > 0$), yields on sovereign short-term government bonds rise as markets price in higher policy rates for longer, boosting the domestic currency.
- If a coincident print falls well short of expectations ($\Delta_{\text{surprise}} < 0$), traders rapidly discount central bank rate cuts, causing the currency to devalue against peers.
2. Validating Trend Continuations
While technical analysts examine moving averages and chart patterns, institutional funds use coincident trends to validate whether a multi-month currency trend is fundamentally backed by productivity. A rallying currency backed by expanding industrial production and strong payrolls represents a high-probability macro trend. Conversely, a currency rallying solely on risk sentiment without coincident economic backing is vulnerable to sharp reversals.
Comparison: Leading, Coincident, and Lagging Indicators
| Feature | Leading Indicators | Coincident Indicators | Lagging Indicators |
|---|---|---|---|
| Timing | Leads business cycle by 3 to 12 months | Occurs synchronously with the cycle | Lags business cycle by 2 to 6 months |
| Primary Utility | Forecasting turning points | Quantifying current economic velocity | Confirming established macro shifts |
| Examples | Yield curve spread, ISM New Orders, Building permits | Real GDP, Non-Farm Payrolls, Industrial Production | CPI Inflation rate, Average prime rate, Unemployment duration |
| Noise Level | Higher (vulnerable to false alarms) | Moderate (undergoes routine revisions) | Low (historical facts finalized) |
Real-World Case Study: USD Reaction to the Non-Farm Payrolls Coincident Release
On the first Friday of each month at 8:30 AM Eastern Time, the U.S. Bureau of Labor Statistics releases the Employment Situation Summary (Non-Farm Payrolls), the world’s most scrutinized coincident data release.
Scenario:
- Pair: EUR/USD trading at 1.0920 ahead of the 8:30 AM release.
- Consensus Forecast: +180,000 new jobs created; Average Hourly Earnings +0.3% MoM.
- Actual Coincident Print: +315,000 jobs created; Average Hourly Earnings +0.5% MoM.
Institutional Mechanism:
- Immediate Algorithmic Inflow: High-frequency trading (HFT) desks parse the BLS machine-readable data feed in under 15 milliseconds. The massive +135,000 beat signals robust real-time corporate hiring.
- Bond Yield Reaction: U.S. 2-Year Treasury yields surge 12 basis points (from 4.20% to 4.32%) as rate futures price out near-term Fed rate cuts.
- Currency Repricing: Driven by widening real interest rate differentials, EUR/USD plunges from 1.0920 to 1.0835 within 10 minutes (an 85-pip decline).
- Follow-Through Confirmation: Over the subsequent sessions, swing traders use the coincident print to establish short positions on EUR/USD rallies, recognizing that consumer demand will keep monetary conditions tight.
Frequently Asked Questions
Why does GDP release have a delay if it is a coincident indicator?
GDP measures coincident economic activity during a specific calendar quarter, but the statistical compilation process requires weeks of data aggregation. The initial release (“Advance Estimate”) is published approximately four weeks after quarter-end, followed by “Preliminary” and “Final” revisions. Even with publication lag, the data describes concurrent economic performance rather than predictive conditions.
Can a coincident indicator give a false signal?
Yes. Coincident indicators frequently undergo substantial revisions in subsequent months as statistical agencies gather more complete source surveys. For instance, an initial positive payroll report can be revised downward sharply in the following month’s release, modifying the market’s assessment of current conditions.
Which coincident indicator is most critical for forex swing traders?
For major currency pairs involving the U.S. dollar, monthly Non-Farm Payrolls (NFP) and Retail Sales offer the highest liquidity and actionable volatility. For commodity currencies like the Australian Dollar (AUD) or Canadian Dollar (CAD), employment changes and national monthly GDP updates dictate baseline central bank policy paths.
Ready to trade forex?
Open a free demo account with a regulated broker. Practice with virtual funds before risking real money.