Construction Spending (Expenditure)
Construction spending (expenditure) is a monthly economic indicator published by the U.S. Census Bureau measuring the total dollar value of new construction work done across private residential, private non-residential, and public sectors.
What Is Construction Spending (Expenditure)?
Construction spending (formally titled Value of Construction Put in Place by the U.S. Census Bureau) is a monthly macroeconomic report that measures the total dollar value of new construction activity completed across the United States. It encompasses all labor and material costs, architectural and engineering work, overhead, interest and taxes paid during construction, and contractor profits.
Because the construction sector accounts for a significant portion of capital investment and employment in advanced economies, construction expenditure serves as a foundational input for estimating real Gross Domestic Product (GDP). Economists and foreign exchange analysts scrutinize the report to evaluate the vitality of the housing market, commercial business expansion, and government fiscal stimulus.
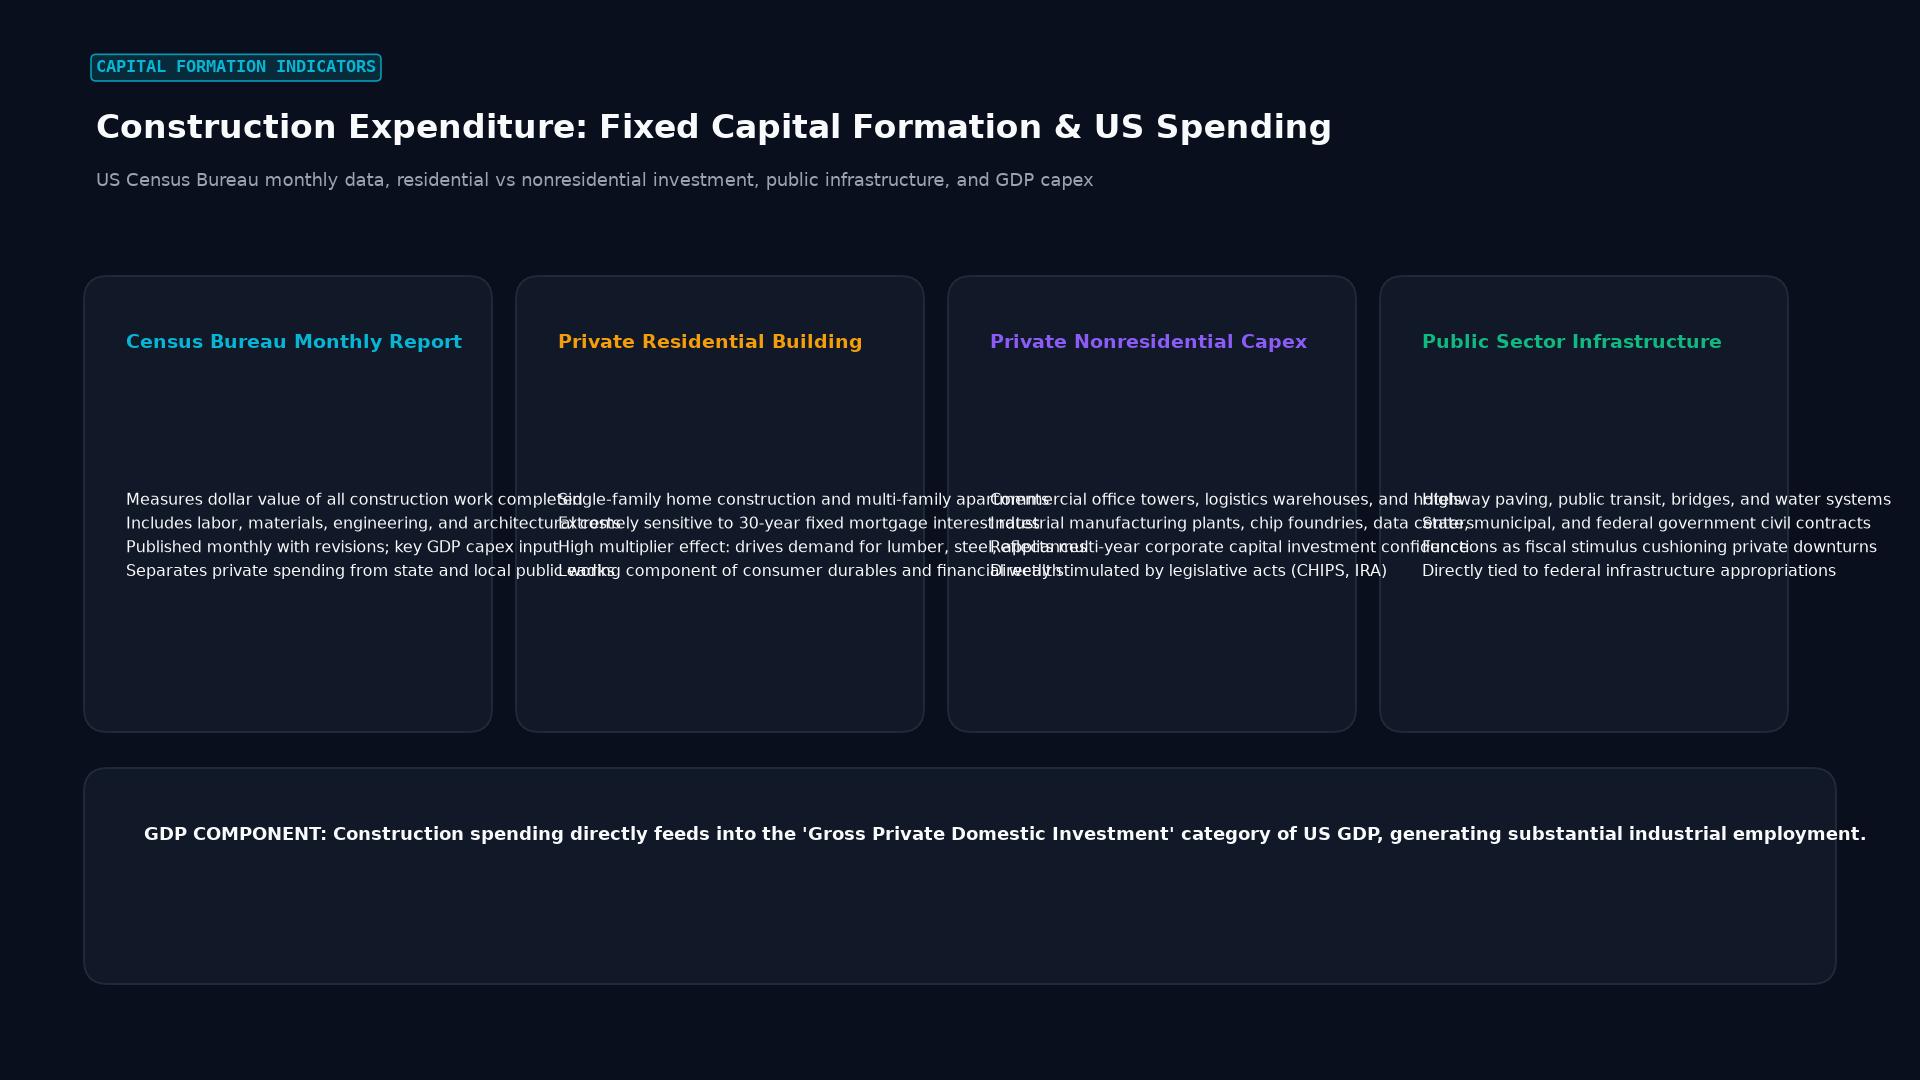 Figure: US Census Bureau monthly data, residential vs nonresidential investment, public infrastructure, and GDP capex
Key Takeaways
- Release Timing: Published monthly by the U.S. Census Bureau on the first business day of the month at 10:00 AM Eastern Time, covering data from two months prior.
- Direct GDP Component: Construction spending feeds directly into the Bureau of Economic Analysis (BEA) calculations for residential and non-residential fixed investment in GDP.
- Interest Rate Sensitivity: The construction sector is the most interest-rate-sensitive component of the macroeconomy; elevated central bank benchmark rates immediately suppress mortgage demand and commercial project financing.
- Leading and Coincident Blend: While architectural billings and building permits lead economic cycles, actual construction expenditure functions as a concurrent barometer of physical capital deployment.
Breakdown of Construction Spending Components
The Census Bureau categorizes construction expenditures into three primary sub-sectors:
| Construction Sector | Sub-Components | Macroeconomic Drivers |
|---|---|---|
| Private Residential | Single-family homes, multi-family apartment buildings, home improvements | Mortgage rates, household formation, real wage growth, building material costs |
| Private Non-Residential | Manufacturing facilities, data centers, warehouses, retail, office buildings | Corporate capital expenditure (CapEx) budgets, supply chain reshoring, commercial credit availability |
| Public Infrastructure | Highways, bridges, educational facilities, public water systems | Federal infrastructure legislation, municipal bond issuance, state tax revenues |
Transmission Channel: From Construction Spending to Currency Valuation
Foreign exchange markets react to construction spending through its direct impact on monetary policy and interest rate expectations:
    ┌──────────────────────────────────┐
    │ Strong Construction Spending     │
    └─────────────────┬────────────────┘
                      │
                      ▼
    ┌──────────────────────────────────┐
    │ Higher BEA GDP Nowcast Estimates │
    └─────────────────┬────────────────┘
                      │
                      ▼
    ┌──────────────────────────────────┐
    │ Bond Yields Rise (Hawkish Rates) │
    └─────────────────┬────────────────┘
                      │
                      ▼
    ┌──────────────────────────────────┐
    │ Currency Appreciation (e.g. USD) │
└──────────────────────────────────┘- GDP Nowcasting Models: Immediately following the 10:00 AM release, institutions update dynamic GDP forecasting algorithms (such as the Atlanta Fed’s GDPNow). Stronger-than-forecast construction expenditures trigger upward revisions to current-quarter GDP growth.
- Inflation and Labor Tightness: High construction spending intensifies competition for specialized labor (carpenters, electricians, heavy machinery operators) and raw commodities (steel, timber, cement), creating wage-push and supply-side inflationary pressures.
- Central Bank Reaction Function: Sustained strength in construction spending provides central banks with evidence of economic resilience, reducing the urgency for interest rate cuts and reinforcing sovereign yield appeal.
Real-World Case Study: USD Volatility on Construction Data Beat
During an economic cycle where the Federal Reserve is debating whether monetary policy is sufficiently restrictive, market consensus expects construction spending to contract by -0.4% month-over-month due to 7.0% mortgage rates.
The Event:
- Pair: GBP/USD trading at 1.2740.
- Release Time: 10:00 AM Eastern Time.
- Consensus: -0.4% MoM.
- Actual Print: +0.9% MoM, driven by a 15% surge in domestic semiconductor manufacturing plant construction (incentivized by federal legislation).
Market Reaction:
- Immediate Algorithmic Repricing: Benchmark 10-Year U.S. Treasury yields rise by 5 basis points as fixed-income traders recognize that fiscal industrial incentives are neutralizing the drag of higher mortgage rates.
- Currency Move: GBP/USD slides from 1.2740 to 1.2695 within 30 minutes (a 45-pip decline).
- Commodity Cross-Impact: Increased industrial construction spending concurrently lifts industrial metal prices (copper futures), providing cross-asset support to commodity currencies such as the Australian Dollar (AUD) against European currencies.
Practical Trading Insights for Forex Traders
- Look Beneath the Headline: A positive headline print driven entirely by government infrastructure spending may mask deteriorating private residential housing. Traders must examine whether private market participants are still borrowing and deploying capital.
- Revisions Are Substantial: Initial construction spending figures are subject to major revisions in the subsequent two months. A strong current release paired with a sharp negative revision to the prior month’s data often creates a “whipsaw” reaction where initial currency gains are quickly faded.
- Synergy with Building Permits: Compare construction spending with forward-looking housing permits. If permits are falling while spending is rising, the current construction pipeline will run dry once active projects reach completion.
Frequently Asked Questions
Why does construction spending release later than building permits?
Building permits are issued before construction commences, making them an early forward-looking signal. Construction spending measures actual capital deployed on the ground as physical progress occurs, requiring extensive accounting reconciliation from contractors, which delays compilation by approximately 60 days.
Is construction spending adjusted for inflation?
The headline Value of Construction Put in Place report is published in nominal (current dollar) terms. However, the Census Bureau also publishes inflation-adjusted (chained dollar) series, which economists use to determine real physical output versus price inflation in building materials.
Does construction spending influence non-U.S. currency pairs?
Yes. Major economies—including the Eurozone, the UK, Japan, and Australia—publish equivalent construction output and construction PMI indices. For example, the UK Construction PMI or Australian Building Approvals frequently trigger direct volatility across GBP and AUD pairs.
Ready to trade forex?
Open a free demo account with a regulated broker. Practice with virtual funds before risking real money.