Continuation (Trend Continuation)
A continuation (trend continuation) in technical analysis refers to the resumption of an established primary trend following a period of consolidation, pause, or counter-trend retracement, often validated by classic chart patterns.
What Is Trend Continuation?
In technical analysis, continuation (or trend continuation) refers to the market dynamic where an asset’s price resumes its dominant, established directional trajectory (either bullish or bearish) following a temporary consolidation phase, pause, or minor corrective counter-trend pullback.
Financial markets do not move in uninterrupted straight lines; instead, they advance in alternating phases of expansion (strong directional impulse moves) and contraction (digestion, profit-taking, and liquidity re-accumulation). When price resolves out of a consolidation in the direction of the preceding trend, market technicians identify this event as a continuation breakout.
Key Takeaways
- High-Probability Edge: In classical trading theory, “the trend is your friend.” Continuation setups offer statistically superior risk-to-reward ratios compared to counter-trend reversal attempts.
- Classic Chart Formations: Technicians recognize several high-reliability continuation patterns: bull/bear flags, pennants, symmetrical triangles, rectangles, and cup-and-handle formations.
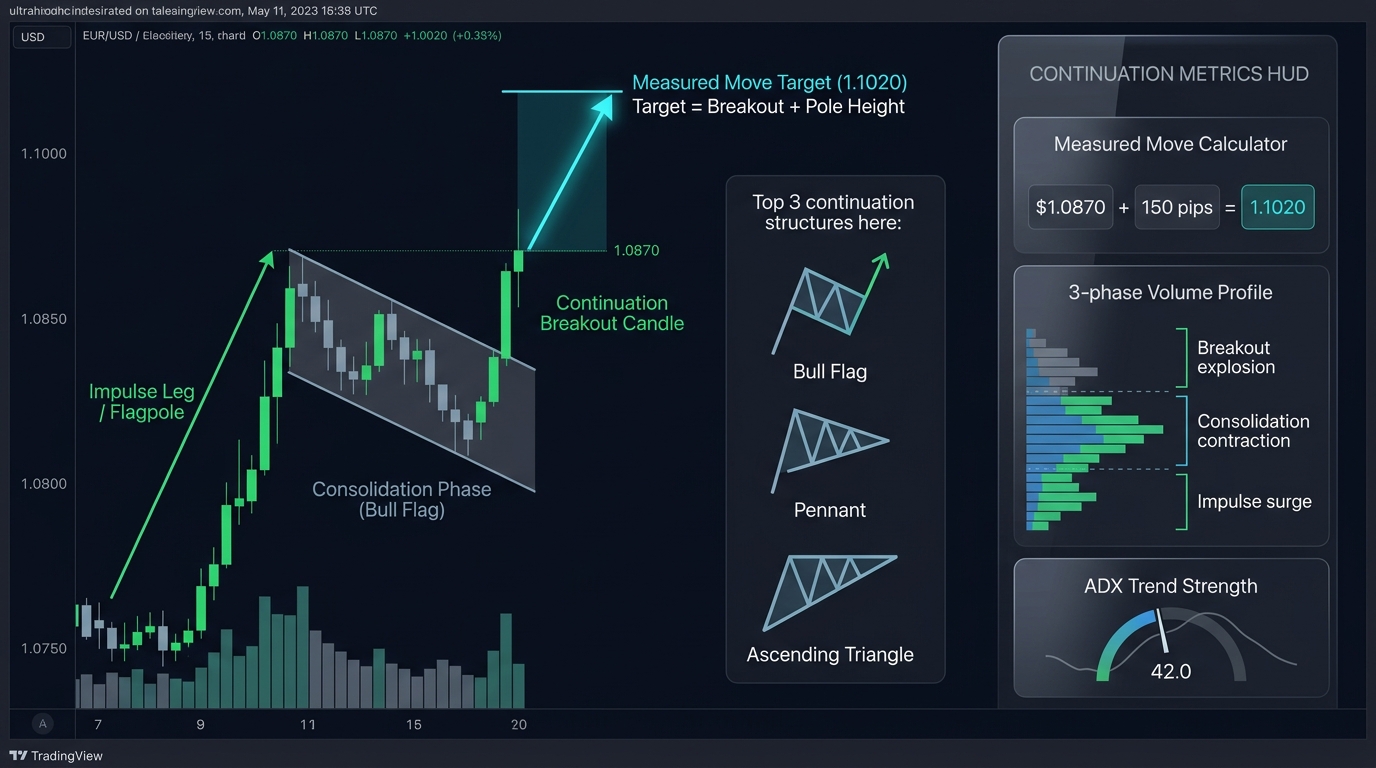
- Volume Signature: Healthy continuation patterns exhibit a distinctive volume cycle: expanding volume during the initial impulse move, contracting volume during the consolidation phase, and explosive volume on the breakout.
- Failed Continuations: If a consolidation breaks against the prevailing macro trend, it triggers a trend reversal, often accelerated by the trapped stop-losses of breakout traders.
Common Continuation Patterns in Forex and Financial Markets
Continuation patterns represent geometric battlegrounds where buyers and sellers temporarily reach equilibrium before one side re-establishes dominance:
| Pattern Name | Visual Geometry | Typical Duration | Bias / Direction |
|---|---|---|---|
| Bull / Bear Flag | A sharp directional impulse leg (“flagpole”) followed by a tight, downward/upward sloping rectangular channel | 1 to 3 weeks (Swing) or several hours (Intraday) | Breaks in the direction of the flagpole |
| Pennant | Converging trendlines forming a small symmetrical triangle immediately after an aggressive vertical price spike | Short duration (5 to 15 candles) | Resolves rapidly in the direction of the pre-spike momentum |
| Ascending Triangle | Flat horizontal resistance ceiling paired with rising higher swing lows | Multi-week accumulation structure | Bullish continuation breakout above horizontal resistance |
| Descending Triangle | Flat horizontal support floor paired with descending lower swing highs | Multi-week distribution structure | Bearish continuation breakdown below horizontal support |
| Horizontal Rectangle | Sideways bounding box between defined parallel support and resistance levels | Extended digestion phase | Breaks in direction of prior entry vector |
Volume and Momentum Confirmation
A genuine trend continuation requires mechanical backing from underlying institutional liquidity. Relying solely on price shapes without volume or momentum validation leads to “bull traps” and “bear traps.”
The Three-Phase Volume Lifecycle:
- The Impulse Phase: Volume expands aggressively as institutional algorithms push price through prior key levels.
- The Consolidation Phase: As price enters a consolidation pattern (e.g., a flag or triangle), volume contracts noticeably. Low volume indicates that the counter-move is merely profit-taking rather than aggressive institutional accumulation in the opposite direction.
- The Expansion (Breakout) Phase: As price pierces the pattern’s boundary line, volume surges, confirming fresh capital participation and driving price toward measured-move objectives.
Momentum Indicators (RSI & MACD):
- In a strong bullish continuation, the Relative Strength Index (RSI) typically bounces off the 40-50 zone during consolidations, refusing to enter oversold territory.
- Moving Average Convergence Divergence (MACD) histogram ticks back toward the zero line during the consolidation before expanding outward again upon breakout.
Real-World Case Study: Trading a Bull Flag Continuation on EUR/USD
Consider a 4-hour chart setup on EUR/USD during an active European Central Bank rate-hiking cycle.
Pattern Formation:
- The Impulse Leg: Over four days, EUR/USD surges 220 pips from 1.0650 to 1.0870 on heavy volume following an ECB rate hike (forming the “flagpole”).
- The Flag Consolidation: Over the next 48 hours, price drifts lower in an orderly, downward-sloping 40-pip channel between 1.0870 and 1.0830. Volume drops by 60% compared to the impulse leg.
- The Continuation Breakout: During the London session open, strong Eurozone flash PMI data hits the wires. EUR/USD breaks above the upper channel resistance line at 1.0855 with a high-volume bullish engulfing candle.
Trade Execution & Risk Management:
- Entry: Long at 1.0860 on the candle close outside the flag.
- Stop-Loss: Placed below the lowest point of the flag consolidation at 1.0825 (35 pips risk).
- Target (Measured Move Rule): The projected continuation target equals the height of the flagpole added to the breakout level: $$\text{Pole Height} = 1.0870 - 1.0650 = 220 \text{ pips}$$ $$\text{Target} = 1.0830 (\text{Flag Low}) + 220 \text{ pips} = 1.1050$$
- Outcome: EUR/USD continues its advance smoothly, reaching 1.1050 over the following seven trading sessions, delivering a 5.4:1 reward-to-risk ratio.
Execution Strategies: Breakout vs. Pullback Entry
Traders deploy two primary methodologies when trading continuation structures:
1. The Aggressive Breakout Entry
- Entering the exact moment price pierces the pattern boundary (e.g., using a buy-stop order placed 2 pips above the upper trendline).
- Advantage: Guarantees participation in fast runaway markets where price does not look back.
- Disadvantage: Higher vulnerability to false breakouts and widened slippage.
2. The Conservative Pullback / Retest Entry
- Waiting for the candle to close outside the pattern, followed by a retest of the broken boundary (which now acts as new support).
- Advantage: Allows tighter stop-losses and higher win rates.
- Disadvantage: Risk of missing strong parabolic trends that explode without providing a retest.
Frequently Asked Questions
What happens when a continuation pattern breaks in the opposite direction?
If a continuation pattern (e.g., a bull flag) breaks down through its support line instead of breaking upward, the pattern is invalidated. The failure often triggers a violent reversal because all traders positioned for a continuation are forced to execute market stop-loss sell orders simultaneously.
Which timeframes are best for identifying continuation patterns?
Continuation patterns are fractal and appear on all timeframes. However, higher timeframes (such as Daily, 4-Hour, and 1-Hour charts) produce significantly more reliable signals with fewer false breakouts than low-timeframe noise (such as 1-minute or 5-minute charts).
How do macroeconomic fundamentals interact with continuation patterns?
Technical continuation patterns often serve as the visual consolidation while markets await scheduled economic catalysts (such as interest rate decisions, CPI prints, or employment data). If the economic news aligns with the preceding trend, it acts as the ignition mechanism for the continuation breakout.
Ready to trade forex?
Open a free demo account with a regulated broker. Practice with virtual funds before risking real money.