Correction
A correction is a price decline of 10% to 20% from a recent peak in financial markets, or a substantial counter-trend retracement in currency trading that temporarily offsets an overextended directional trend before resuming or reversing.
What Is a Market Correction?
A correction is a sustained, counter-trend price movement that partially retraces an established prior trend, serving as a market mechanism to digest overextended momentum, purge speculative leverage, and align prices with underlying economic fundamentals.
The term carries distinct technical definitions depending on the asset class:
- In Equity Markets and Major Indices: A correction is formally defined as a price decline of at least 10% but less than 20% from a recent 52-week peak. A decline of less than 10% is classified as a minor pullback, whereas a drop exceeding 20% marks the formal transition into a bear market.
- In Foreign Exchange and Commodity Markets: Because currencies trade in relative pairs with lower baseline volatility, a correction refers to a significant counter-trend retracement (often spanning 200 to 500 pips on daily charts) that temporarily unwinds an overbought or oversold technical condition before the primary macro trend resumes.
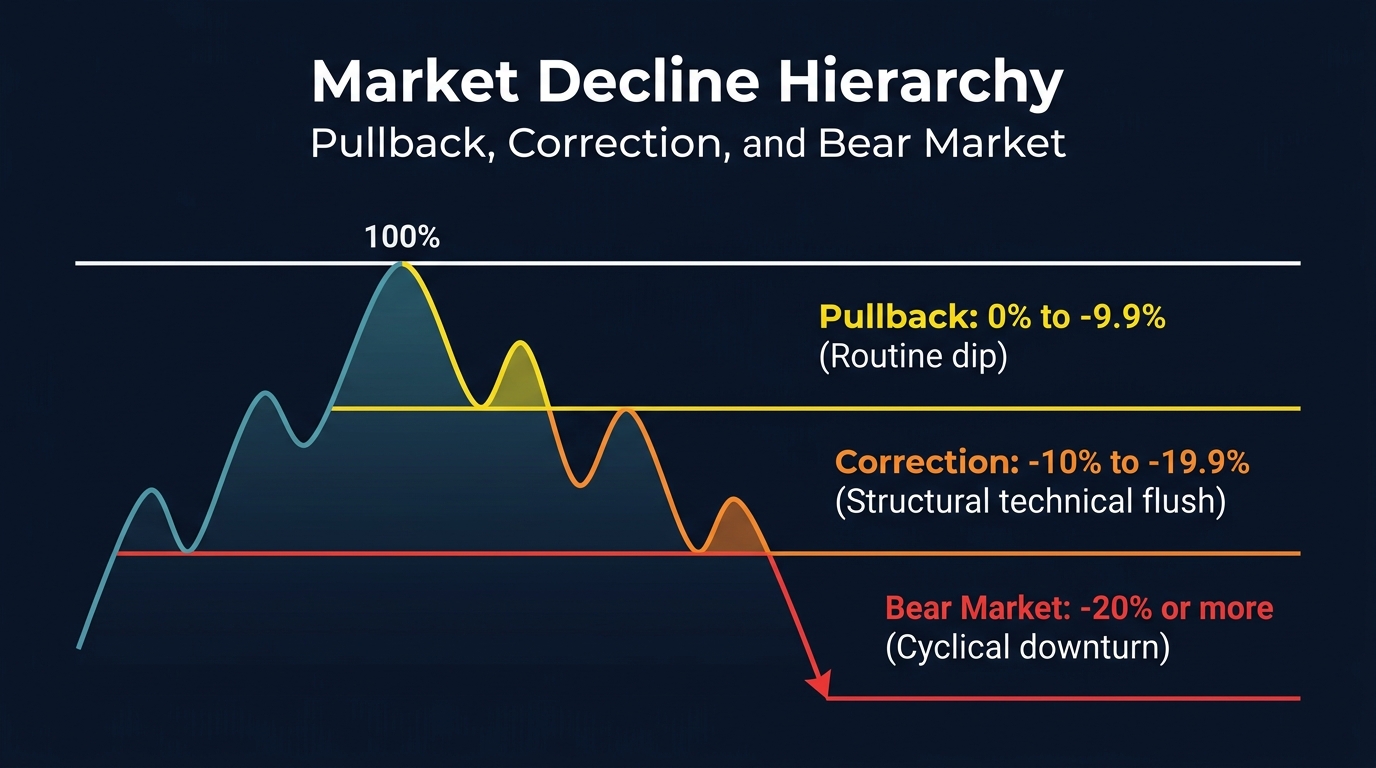
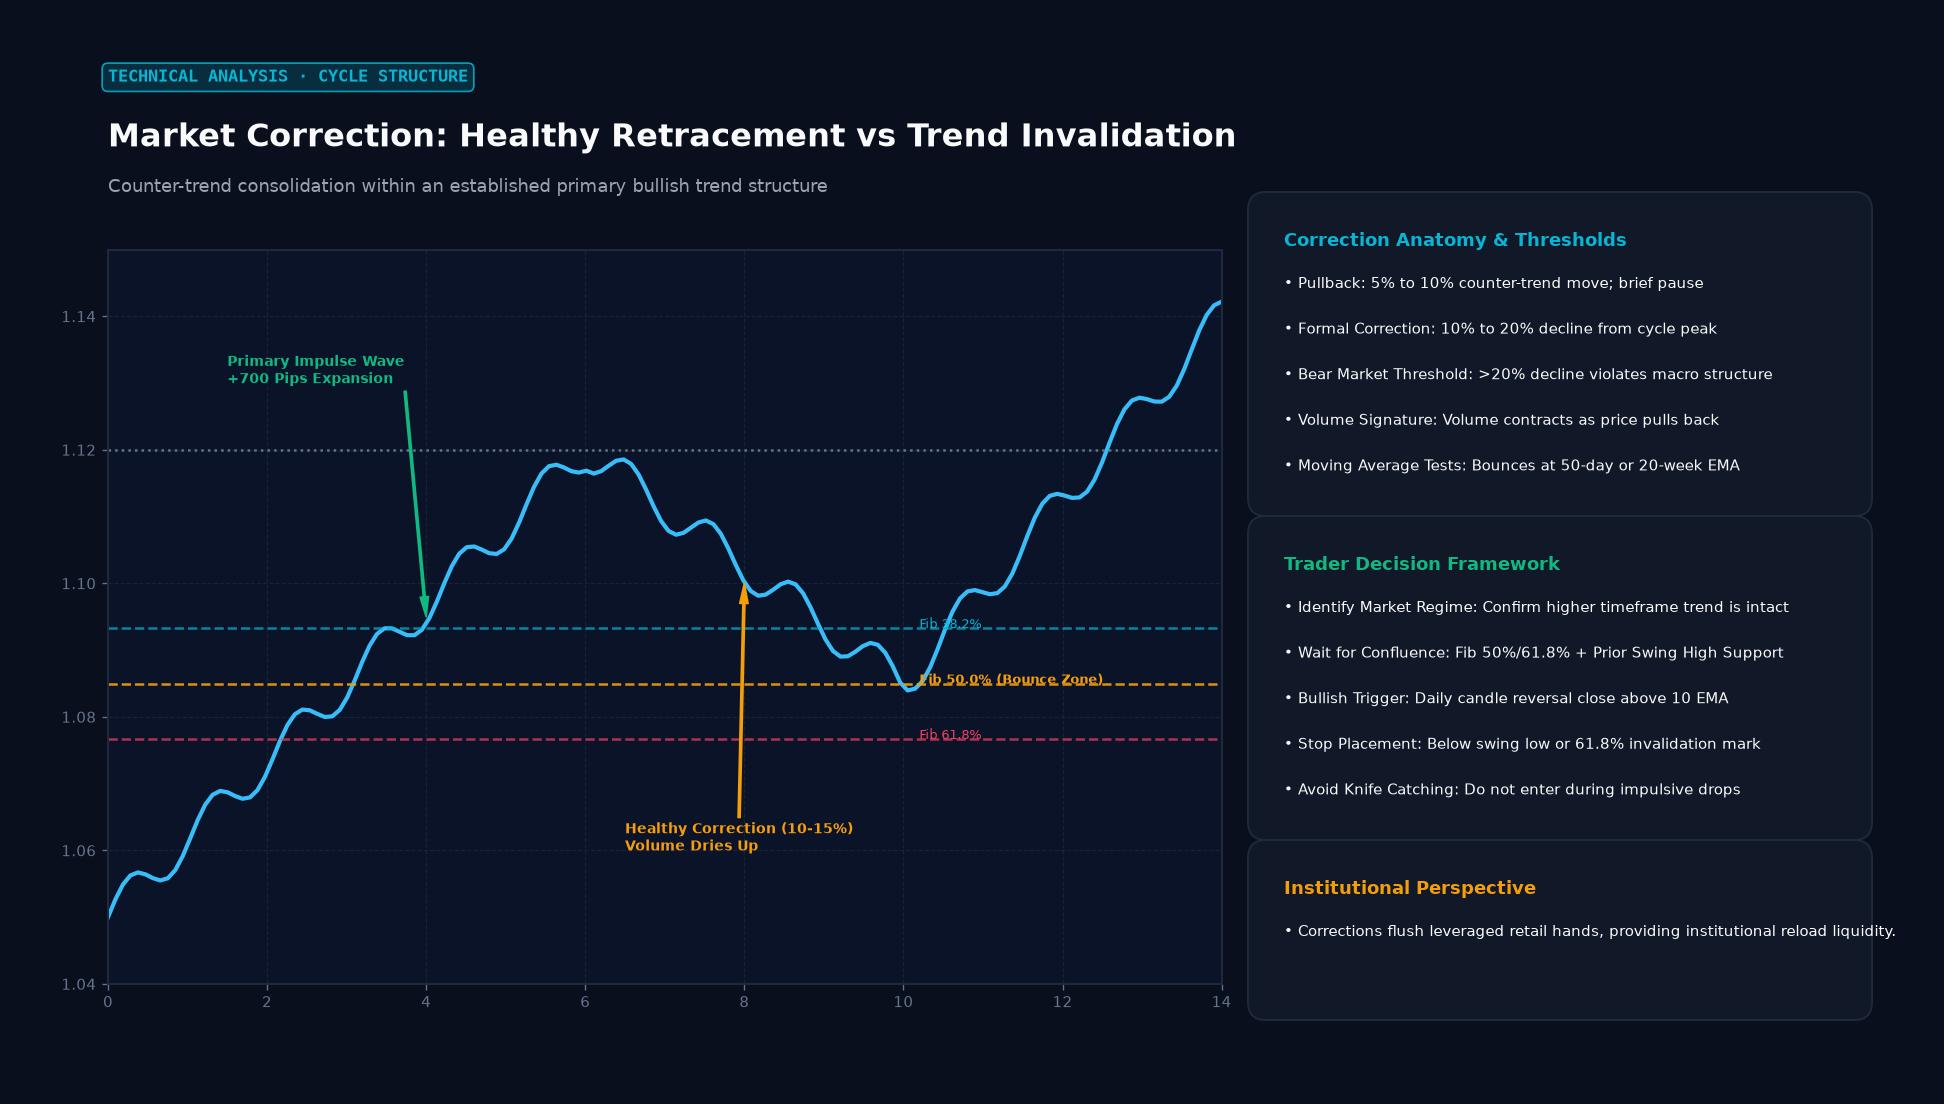 Figure: Counter-trend consolidation within an established primary bullish trend structure
Key Takeaways
- Healthy Market Function: Corrections are a natural, necessary component of healthy bull markets; they prevent speculative asset bubbles from detaching completely from earnings and cash flows.
- Duration and Frequency: In equity benchmarks like the S&P 500, a 10% correction occurs on average once every 1.5 to 2 years, with an average recovery time of approximately three to four months.
- Fibonacci Retracement Framework: In forex technical analysis, corrections typically find institutional buying or selling support at standardized Fibonacci levels: 38.2%, 50.0%, or 61.8% of the prior impulse wave.
- Correction vs. Reversal: A correction is temporary, resolving in the direction of the dominant macro trend; a reversal permanently breaks structural market architecture (lower highs and lower lows).
Technical Anatomy of a Forex Correction
Currency market corrections unfold through a recurring psychological and mechanical lifecycle:
                      Cycle Peak (Overbought / RSI > 75)
                             ▲
                            / \   Leg A: Initial sharp liquidation
                           /   \
                          /     ▼
                         /       ▲
                        /         \ Leg B: Weak dead-cat bounce
                       /           \
                      /             ▼ Leg C: Final capitulation (Retracement Complete)
                     /
Prior Macro Trend /- Phase 1: Exhaustion & Profit-Taking: Retail traders chase a parabolic currency rally while institutional desks begin distributing long positions to lock in profits, pushing momentum oscillators (RSI, Stochastic) into extreme overbought territory.
- Phase 2: The Initial Flush (Leg A): An unexpected catalyst (such as a mild economic data miss or a central bank official striking a less aggressive tone) triggers a sharp downward impulse as trailing stop-losses are swept.
- Phase 3: The Counter-Rally (Leg B): Uninformed dip-buyers attempt to re-enter, creating a weak, low-volume bounce that fails to establish a new high.
- Phase 4: Capitulation & Liquidity Cleanse (Leg C): A secondary downward wave shakes out late longs and cleanses remaining leverage, driving price into major moving average support (e.g., the 50-day or 200-day EMA).
Measuring Corrections: Key Retracement Benchmarks
Technical analysts quantify the depth of a correction using mathematical ratios and moving average bands:
| Retracement Level | Depth Characterization | Market Health Interpretation | Institutional Action |
|---|---|---|---|
| 23.6% Retracement | Shallow Dip | Exceptionally aggressive runaway trend | High-frequency momentum algorithms aggressively buy |
| 38.2% Retracement | Standard Correction | Healthy, sustainable trend continuation | Institutional funds accumulate primary trend positions |
| 50.0% Retracement | Deep Rebalancing | Dow Theory baseline equilibrium point | High liquidity absorption zone |
| 61.8% (“Golden Pocket”) | Maximum Corrective Boundary | Critical structural threshold | Last line of defense before full trend invalidation |
| > 78.6% Retracement | Severe Trend Breakdown | High probability of full secular trend reversal | Technical invalidation; trend is deemed terminated |
Real-World Case Study: Trading a EUR/USD Correction
During an active monetary tightening campaign by the European Central Bank, EUR/USD executes a strong macro rally from 1.0500 up to 1.1200 (a 700-pip impulse wave over ten weeks).
The Correction Trigger:
- At 1.1200, the Daily RSI reaches 78 (heavily overbought).
- Eurozone preliminary inflation figures show a sharper-than-expected cooling, prompting investors to trim rate-hike bets.
- Over the next four weeks, EUR/USD enters an orderly downward correction, sliding from 1.1200 down to 1.0850 (a 350-pip decline).
Technical Confirmation of Correction End:
- Fibonacci Alignment: $$\text{Impulse Move} = 1.1200 - 1.0500 = 700 \text{ pips}$$ $$50% \text{ Retracement Level} = 1.1200 - (700 \times 0.50) = 1.0850$$ The price lands exactly on the 50.0% mathematical retracement level.
- Dynamic Support Confluence: The 1.0850 level coincides directly with the rising 200-day Exponential Moving Average (EMA) and prior horizontal resistance from the previous cycle.
- Candlestick Confirmation: A daily bullish hammer candlestick forms at 1.0850 on expanding volume, confirming that institutional dip-buyers have entered the market.
- Trade Execution: Traders enter long at 1.0875 with a stop-loss at 1.0790 (85 pips risk). EUR/USD resumes its primary trend, rallying over the next two months to break above 1.1350.
How to Distinguish a Correction from a Market Crash or Reversal
Confusing a routine correction with an irreversible market crash is one of the most common errors made by retail traders:
| Criterion | Healthy Correction | Secular Reversal / Crash |
|---|---|---|
| Macro Backdrop | Broad economic expansion remains intact; rates stable | Structural macroeconomic deterioration, systemic banking crisis |
| Price Action | Orderly, overlapping candles with contracting volume | Parabolic gaps, limit-down locks, massive volume spikes |
| Key Support Tests | Bounces cleanly off moving averages (50/200 EMA) or Fib levels | Slices through multi-year support levels without resistance |
| Market Breadth | Isolated to overextended leaders; broad market holds | Systemic selling across 90%+ of all assets and currencies |
Frequently Asked Questions
How long does a typical market correction last?
In equity markets, historical corrections of 10% to 15% last an average of 3 to 4 months from peak to trough, followed by a 3-month recovery back to previous highs. In forex markets, swing corrections on 4-hour and daily charts typically resolve within two to three weeks.
Should long-term investors sell during a correction?
For long-term passive investors, selling during a correction often locks in losses and triggers adverse capital gains taxes. Historically, every correction in broad benchmark indices (like the S&P 500) has eventually been surpassed by new all-time highs, making dollar-cost averaging into corrections an effective long-term strategy.
What is the best indicator to spot an impending correction?
The combination of momentum divergence on the Relative Strength Index (RSI) or MACD—where price makes a higher high while the indicator creates a lower high—paired with extreme readings in speculative commitments (such as the CFTC COT report) provides the most reliable early warning of an impending correction.
Ready to trade forex?
Open a free demo account with a regulated broker. Practice with virtual funds before risking real money.