Cyclical
Cyclical refers to financial assets, corporate sectors, or national currencies whose performance, revenues, and valuations are heavily correlated with the expansion and contraction phases of the macroeconomic business cycle.
What Is a Cyclical Asset?
In macroeconomic analysis and investment strategy, cyclical describes any financial security, industrial sector, or national currency whose revenues, profitability, and market price movements follow the natural ebbs and flows of the broader business cycle.
When the macroeconomy is in an expansionary phase characterized by rising Gross Domestic Product (GDP), expanding corporate capital expenditures, high consumer confidence, and job growth, cyclical assets thrive and outperform the broader market. Conversely, during economic slowdowns, tightening monetary conditions, or outright recessions, demand for cyclical goods and services collapses rapidly, causing cyclical asset prices to experience severe declines.
In foreign exchange, cyclicality manifests through cyclical currencies (such as the Australian Dollar, New Zealand Dollar, and Canadian Dollar), which surge during global industrial expansions and plummet during global recessions in stark contrast to defensive or counter-cyclical safe-haven currencies (such as the U.S. Dollar, Swiss Franc, and Japanese Yen).
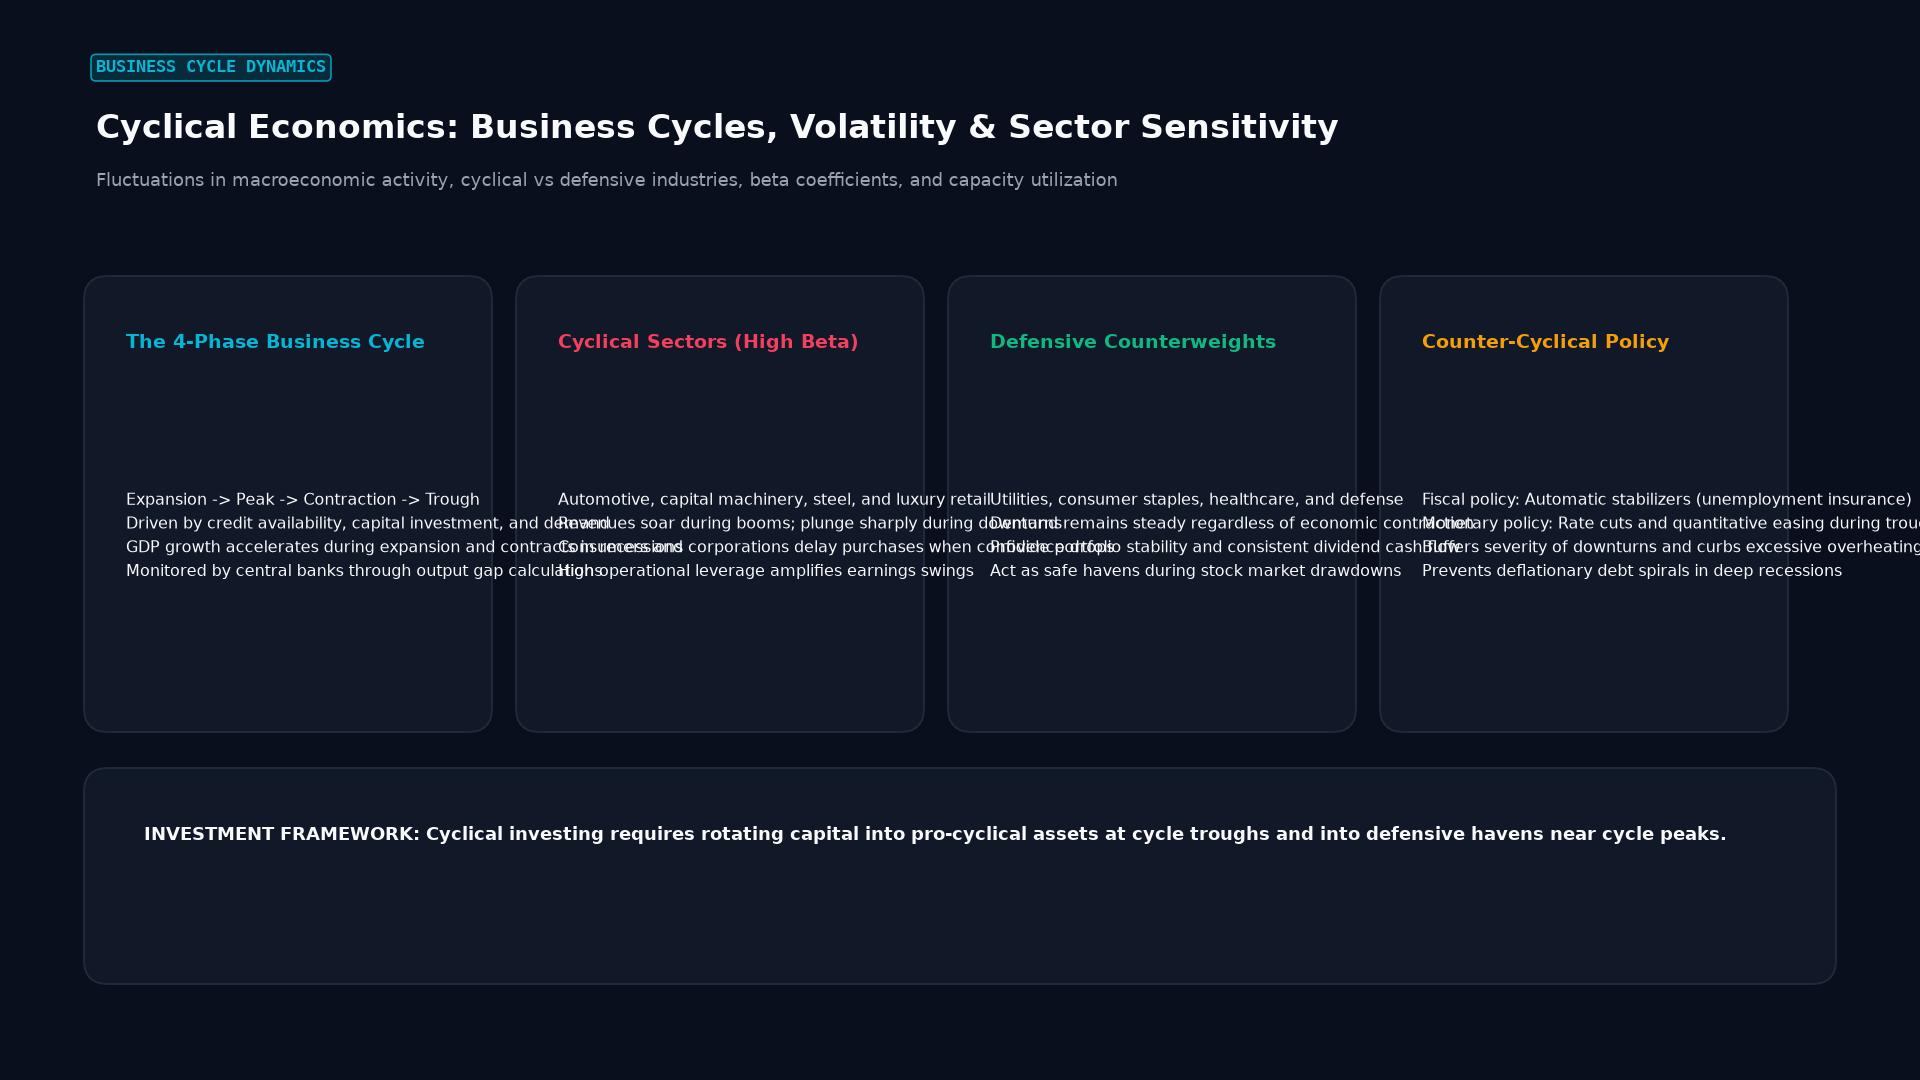 Figure: Fluctuations in macroeconomic activity, cyclical vs defensive industries, beta coefficients, and capacity utilization
Key Takeaways
- High-Beta Volatility: Cyclical assets exhibit high volatility and high economic beta ($\beta > 1.0$), magnifying swings in benchmark equity indexes and gross domestic product.
- Cyclical vs. Defensive: While cyclical industries produce discretionary goods that consumers and corporations postpone during hard times (e.g., luxury travel, heavy machinery, automotive), defensive sectors produce non-discretionary staples (e.g., electricity, groceries, pharmaceuticals) that maintain stable demand in any economy.
- Commodity-Currency Transmission: In the forex market, commodity-exporting currencies act as the ultimate global cyclical assets, rising in tandem with worldwide industrial manufacturing demand for raw materials (copper, iron ore, crude oil).
- Sector Rotation Strategy: Institutional portfolio managers deploy sector rotation models, systematically reallocating capital out of cyclical assets into defensive assets as leading economic indicators signal peak cycle momentum.
Cyclical vs. Defensive Asset Taxonomy
Understanding the divergence between cyclical and defensive sectors is foundational for cross-asset macro trading:
| Dimension | Cyclical Assets & Sectors | Defensive (Non-Cyclical) Assets |
|---|---|---|
| Representative Sectors | Consumer Discretionary, Industrials, Semiconductors, Mining, Automotive, Energy | Utilities, Consumer Staples, Healthcare, Defense Contractors |
| Typical Products | Automobiles, airline tickets, factory robots, construction materials, semiconductors | Electricity, water, prescription medications, packaged food, household cleaning products |
| Revenue Sensitivity | High: Plummets during recessions; surges during booms | Low: Stable, recurring, inelastic consumer demand |
| Operating Leverage | High fixed costs; large operational swings in net profit margins | Low fixed costs; steady, bond-like recurring cash flows |
| Forex Currencies | Cyclical: AUD, NZD, CAD, NOK, KRW, ZAR, BRL | Counter-Cyclical / Defensive: USD, CHF, JPY |
Cyclical Currencies in the Foreign Exchange Matrix
In global currency markets, exchange rates do not merely reflect bilateral interest rate differentials—they reflect the global risk regime:
1. High-Beta Commodity Exporters (AUD, NZD, CAD)
- Australia and New Zealand: Export massive volumes of iron ore, metallurgical coal, copper, and agricultural goods to China and developing Asia. When global factories run at full capacity, export revenues soar, driving large capital inflows that strengthen AUD and NZD.
- Canada and Norway: Major global exporters of crude oil and petroleum products. Surging industrial energy demand directly lifts CAD and NOK.
2. The Safe-Haven Counter-Cycle (USD, CHF, JPY)
When the global economic cycle turns downward into recession:
- Global manufacturing purchasing managers’ indices (PMIs) fall below 50.0.
- International trade volumes collapse, crushing commodity prices.
- International fund managers dump high-yielding cyclical emerging currencies and repatriate capital into safe-haven sovereign bonds, driving violent appreciation in the U.S. Dollar, Swiss Franc, and Japanese Yen.
Global Cycle Expansion ──► Commodity Prices Surge ──► Buy AUD, NZD, CAD / Sell USD, JPY
Global Cycle Recession ──► Factory Output Plummets ──► Buy USD, CHF, JPY / Sell AUD, NZD
Real-World Case Study: Trading the Post-Pandemic Cyclical Boom (2020–2021)
The recovery following the initial March 2020 pandemic lockdown provides a textbook example of cyclical rotation:
The Setup:
- In March 2020, global GDP contracted violently, pushing the cyclical AUD/USD pair down to a multi-decade low of
0.5510. - Worldwide central banks and governments responded with coordinated fiscal stimulus checks and trillions of dollars in quantitative easing.
The Cyclical Super-Cycle:
- Demand Explosion: Global consumers confined to homes purchased electronics, appliances, and home renovations. Industrial commodity prices skyrocketed: copper reached record highs above $10,000 per ton, and iron ore surged past $220 per ton.
- Institutional Rotation: Global macro funds aggressively rotated out of defensive cash and utilities into cyclical mining shares and commodity currencies.
- Forex Move: AUD/USD rallied relentlessly from
0.5510in March 2020 to peak at0.8007in February 2021—a massive +2,500-pip cyclical gain (+45%) within eleven months. - The Reversal: Once the Federal Reserve initiated aggressive interest rate hikes in early 2022 to combat inflation, slowing the business cycle, AUD/USD surrendered its cyclical gains, sliding back below 0.6500.
Investment Strategies: Exploiting Cyclical Inflection Points
To capitalize on cyclical fluctuations, investors utilize specific quantitative and macroeconomic tools:
- The ISM Manufacturing PMI Threshold: The Institute for Supply Management’s Manufacturing Index functions as the ultimate cyclical compass. When the PMI crosses above 50.0 from an oversold trough (e.g., 43.0), it provides a high-conviction buy signal for cyclical equities and currencies.
- Yield Curve Steepening: Following a recession, an un-inverting and steepening sovereign yield curve (where 10-year yields rise faster than 2-year yields) signals that banks will profit from lending, heralding the beginning of an early-cycle bull run.
Frequently Asked Questions
Can a stock or company change from cyclical to defensive?
Yes. Over decades, companies that successfully shift from one-time capital equipment sales to recurring subscription services (Software as a Service - SaaS) or diversify into non-discretionary consumables can dampen their revenue volatility, transitioning from a pure cyclical valuation into a defensive hybrid profile.
Why do cyclical stocks often look cheap at the peak of the cycle?
At the peak of an economic boom, cyclical companies generate peak record earnings, making their Price-to-Earnings (P/E) ratio appear artificially low (e.g., 6x P/E). Experienced institutional investors avoid buying cyclicals at low P/E multiples because earnings are about to collapse; paradoxically, the best time to buy cyclicals is when their P/E is sky-high or negative at the bottom of a recession when earnings have temporarily evaporated.
How do luxury brands behave during cyclical downturns?
Ultra-luxury goods (e.g., Ferrari, Hermès) often demonstrate surprisingly defensive resilience because their ultra-high-net-worth customer base is insulated from middle-class unemployment and consumer credit crunches. In contrast, “aspirational luxury” brands heavily exposed to debt-financed consumer spending experience severe cyclical declines.
Ready to trade forex?
Open a free demo account with a regulated broker. Practice with virtual funds before risking real money.