Days Sales Outstanding (DSO - Days Receivable)
Days Sales Outstanding (DSO), commonly termed days receivable, is a corporate efficiency and liquidity metric that calculates the average number of days a business takes to collect cash payment following a credit sale.
What Is Days Sales Outstanding (DSO)?
Days Sales Outstanding (DSO)—frequently referred to as days receivable, the average collection period, or debtor days—is a fundamental financial efficiency ratio that measures the average number of calendar days it takes for a commercial enterprise to collect cash payment from its customers following a credit sale.
In corporate financial management and equity analysis, DSO serves as a vital barometer of operational health and working capital management. A low DSO indicates that a company operates an efficient accounts receivable collection department, maintains high-credit-quality customers, and rapidly converts paper credit revenue into liquid cash.
Conversely, a high or expanding DSO warns equity analysts that the business is struggling to collect payments, extending overly generous credit terms to mask declining sales demand, or facing customer solvency defaults.
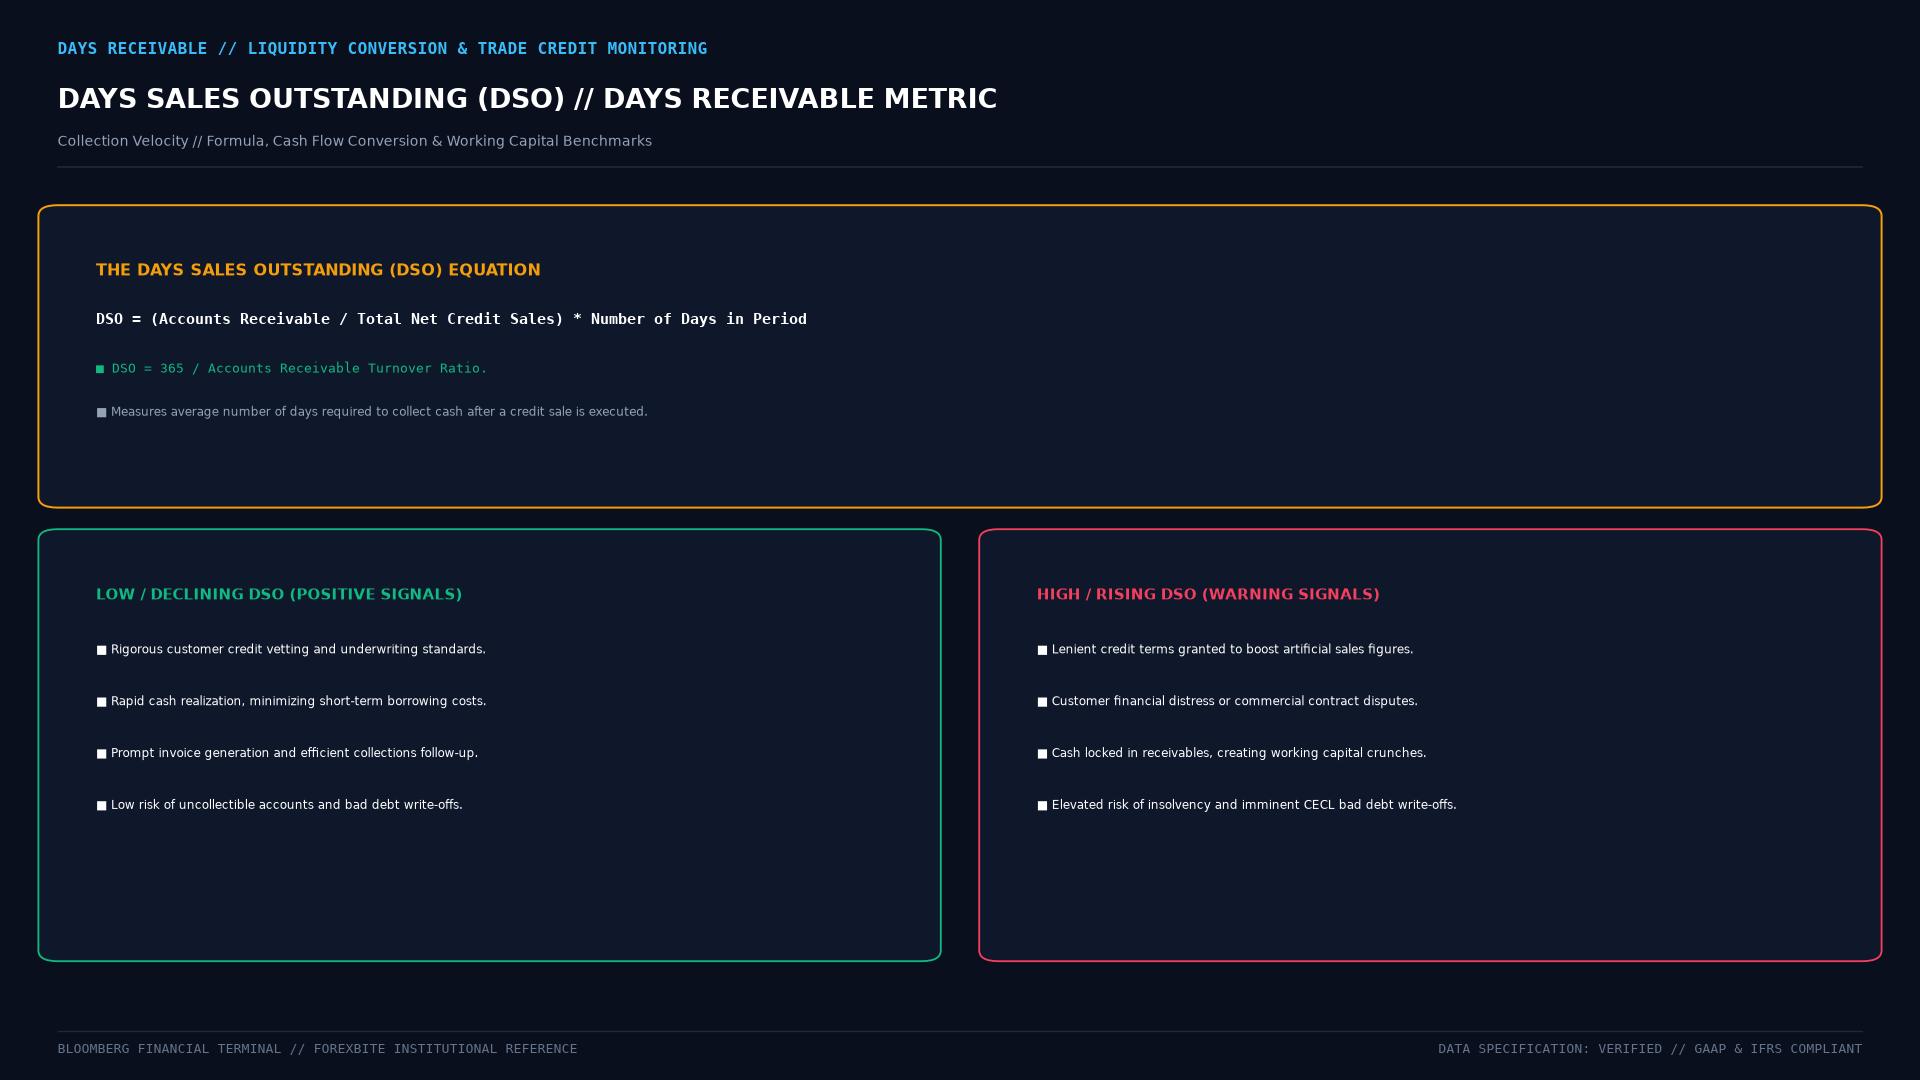 Figure: Days Sales Outstanding (DSO) calculation methodology, Cash Conversion Cycle (CCC) timeline, and the financial impact of collection efficiency on working capital and liquidity.
Technical Mechanics & Mathematical Formulation
The standard calculation of Days Sales Outstanding evaluates the ending accounts receivable balance against total credit sales across a specific financial reporting period:
The Classic DSO Formula
$$\text{DSO} = \left( \frac{\text{Accounts Receivable}}{\text{Total Credit Sales}} \right) \times N$$
Where:
- $\text{Accounts Receivable}$: Total uncollected customer invoices at the end of the period (from the corporate balance sheet).
- $\text{Total Credit Sales}$: Net revenue generated strictly through credit terms (from the income statement). Cash sales are excluded, as they do not generate receivables.
- $N$: Number of calendar days in the measurement period ($90$ days for quarterly filings, $365$ days for annual 10-K filings).
The Accounts Receivable Turnover Link
DSO is the mathematical inverse of the Accounts Receivable (AR) Turnover Ratio:
$$\text{AR Turnover} = \frac{\text{Total Credit Sales}}{\text{Average Accounts Receivable}}$$
$$\text{DSO} = \frac{365}{\text{AR Turnover}}$$
If a manufacturing corporation reports annual credit sales of $120 million and holds an average accounts receivable balance of $20 million:
$$\text{AR Turnover} = \frac{$120\text{M}}{$20\text{M}} = 6.0 \text{ times per year}$$
$$\text{DSO} = \frac{365}{6.0} \approx 60.83 \text{ days}$$
On average, the corporation waits roughly 61 days to collect cash after shipping products.
Forensic Accounting: DSO as a Warning Metric
In forensic equity research, analyzing the divergence between Revenue Growth Rate and DSO Expansion Rate is one of the most reliable methods to detect fraudulent corporate accounting:
| Forensic Pattern | Underlying Business Reality | Financial Reporting Risk |
|---|---|---|
| Stable Revenue + Declining DSO | Improving collections; high customer cash flow | Robust earnings quality; high free cash conversion |
| Growing Revenue + Stable DSO | Healthy organic commercial expansion | Standard sustainable business model |
| Flat Revenue + Rapidly Rising DSO | Customers delaying payments; liquidity stress | Imminent bad debt write-offs |
| Surging Revenue + Surging DSO | “Channel Stuffing” / Aggressive revenue recognition | High risk of future earnings restatement |
Real-World Case Study: The Lucent Technologies Accounting Collapse (2000)
The catastrophic failure to monitor expanding days receivable was exemplified during the downfall of telecommunications equipment giant Lucent Technologies in 2000.
Anatomy of a Channel-Stuffing Meltdown:
1. The Pressure: During the late 1990s telecom bubble, Lucent faced intense Wall Street pressure to report 20%+ quarterly revenue growth.
2. The Scheme (Vendor Financing): To hit quarterly sales quotas, Lucent offered massive vendor financing loans to speculative startup telecom companies, recognizing the sales immediately as revenue while accepting deferred IOUs.
3. The Red Flag: While reported revenue surged, Lucent's Days Sales Outstanding (DSO) exploded from an industry-standard 65 days to over 115 days, with total accounts receivable swelling past $10 billion.
4. The Collapse: When the dot-com bubble burst, the startup customers went bankrupt. Lucent could not collect its receivables, forcing an unprecedented $4 billion in bad debt write-offs, massive SEC accounting fraud fines, and an 80% collapse in share price.
Forensic analysts who tracked Lucent’s surging DSO identified the fraud quarters before official earnings restatements were published.
Frequently Asked Questions (FAQ)
What is considered a “good” or healthy Days Sales Outstanding (DSO)?
Generally, a DSO under 45 days is considered healthy for most commercial and manufacturing industries. However, DSO benchmarks vary drastically across sectors. Supermarket retail and online e-commerce companies operate with a DSO near zero because retail consumers pay instantly with debit or credit cards. In contrast, aerospace defense contractors or heavy industrial engineering firms routinely operate with DSOs between 60 and 90 days due to complex milestone billing and government procurement audit cycles.
What is the difference between DSO and Days Payable Outstanding (DPO)?
Days Sales Outstanding (DSO) measures the speed at which a company collects cash from its customers (an asset metric). Days Payable Outstanding (DPO) measures the average number of days a company takes to pay cash to its suppliers and vendors (a liability metric). In working capital management, corporate treasurers seek to minimize DSO (collect cash rapidly) while maximizing DPO (hold onto cash before paying suppliers as long as possible without penalty).
How does seasonality distort quarterly DSO calculations?
If a corporation experiences heavy seasonal sales (for example, a toy manufacturer generating 60% of annual revenue during Q4), calculating DSO using standard quarterly formulas can produce deceptive spikes. Because receivables are measured at the end of December (when holiday credit sales are at their absolute peak), the fourth-quarter DSO will appear artificially inflated. To eliminate this distortion, financial analysts compute Countback DSO or evaluate DSO against the identical quarter from the prior year (YoY comparison).
Ready to trade forex?
Open a free demo account with a regulated broker. Practice with virtual funds before risking real money.