Drawdown
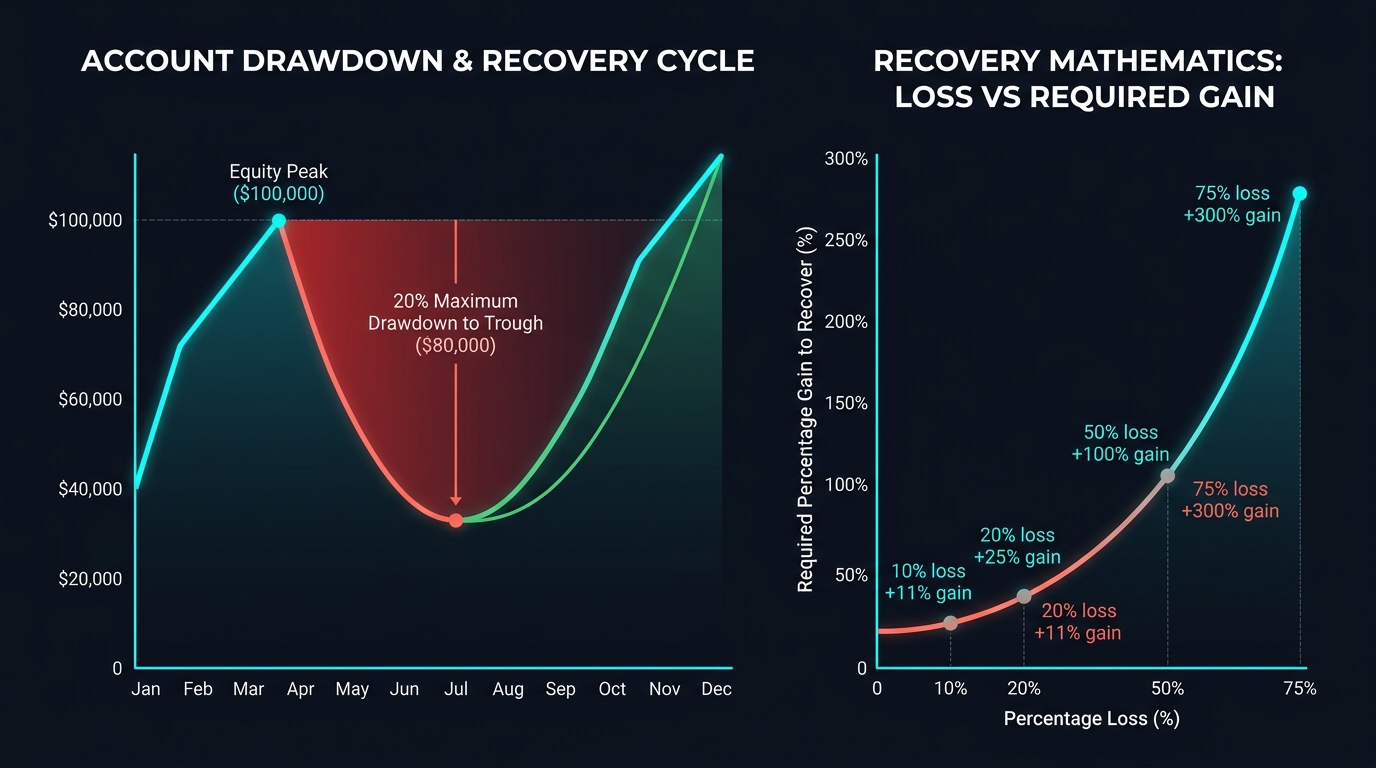
Drawdown is the peak-to-trough decline in a trading account's equity over a specific period. It measures the worst-case loss scenario from any given high point, expressed in dollar terms or as a percentage. Drawdown is the primary measure of risk in evaluating any trading strategy — more important, in many professional frameworks, than the win rate or average return.
What Drawdown Tells You That Returns Don’t
Two trading accounts both return 20% per year. Account A achieves this with a maximum drawdown of 5%. Account B achieves it with a maximum drawdown of 45%. Are they equivalent? Not even remotely.
Account B requires its operator to sit through watching 45% of their capital disappear before recovering. At $100,000, that’s a $45,000 loss on paper. Most traders can’t maintain discipline through a 45% drawdown — they abandon the strategy at the worst possible moment (the bottom), crystallizing the loss instead of capturing the recovery.
Account A’s 5% maximum drawdown means the worst it ever looked was a $5,000 temporary decline. This is psychologically manageable. The strategy can be executed consistently.
Drawdown is what strategy risk actually feels like in real time.
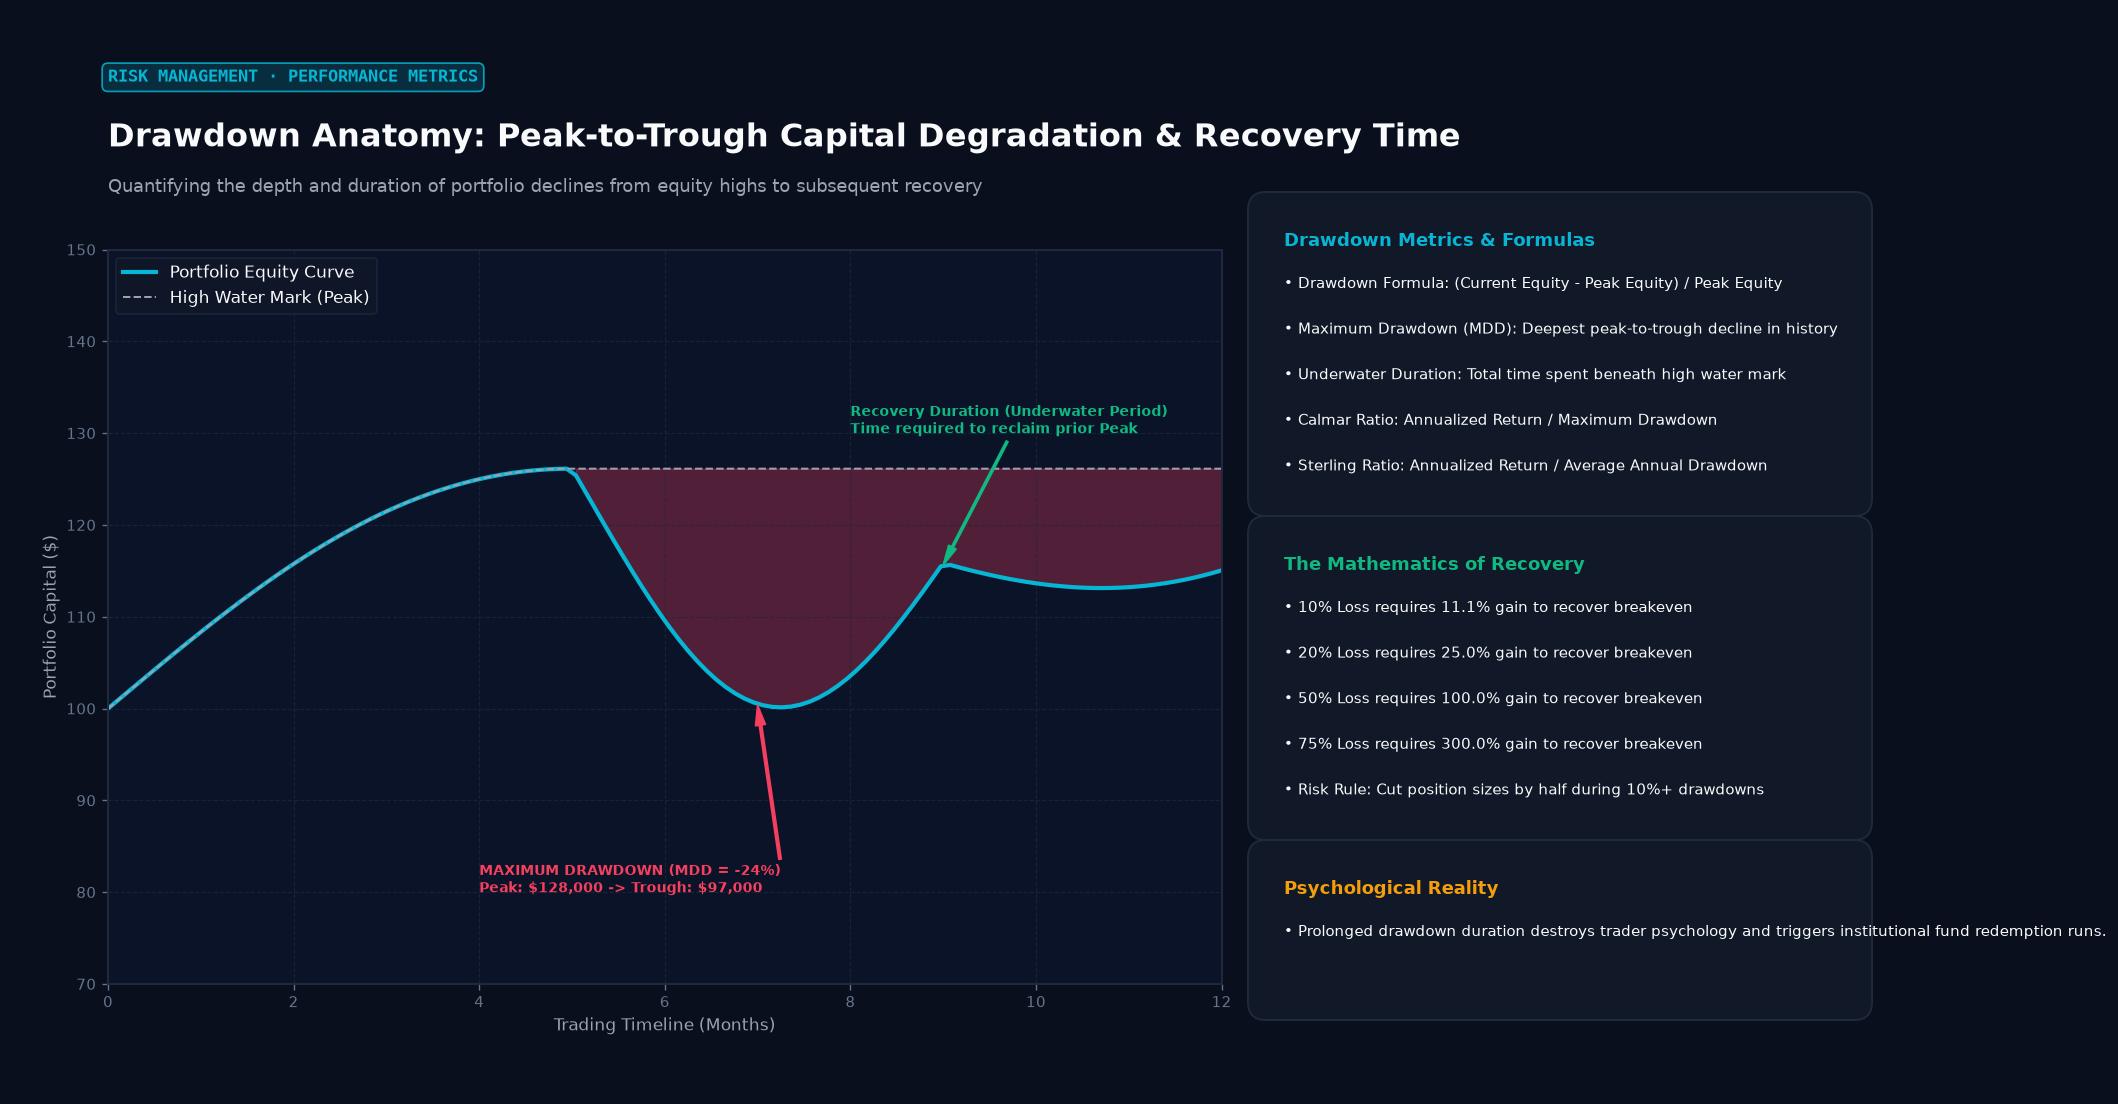 Figure: Quantifying the depth and duration of portfolio declines from equity highs to subsequent recovery
Types of Drawdown
Maximum Drawdown (MDD): The largest peak-to-trough decline over the entire history of the account. If an account grew from $10,000 to $18,000, then fell to $9,000, the maximum drawdown is 50% (from the $18,000 peak to the $9,000 trough). MDD is the number most cited when evaluating strategy risk.
Current Drawdown: How far the account currently sits below its all-time high. If you’re currently at $15,000 after a high of $18,000, current drawdown is 16.7%. Monitoring current drawdown helps traders recognize when a strategy is underperforming and whether a review is warranted.
Average Drawdown: The average depth of all drawdown periods in the account history. Gives a more representative picture than MDD alone — some strategies have one catastrophic drawdown and normal periods are fine; others have consistently moderate drawdowns.
The Math of Recovery
The asymmetry of drawdowns is critically important and consistently underappreciated:
| Drawdown | Recovery Required |
|---|---|
| 10% | 11.1% |
| 20% | 25.0% |
| 30% | 42.9% |
| 40% | 66.7% |
| 50% | 100.0% |
| 60% | 150.0% |
A 50% drawdown requires a 100% gain just to break even. A 60% drawdown requires a 150% gain. These numbers explain why preserving capital during drawdown periods is more mathematically valuable than trying to “trade your way out” of losses with bigger position sizes.
Drawdown and Leverage
Leverage amplifies drawdowns as effectively as it amplifies gains. At 10:1 leverage, a 5% adverse move in a currency pair creates a 50% drawdown. This is why professional risk managers set maximum leverage not at the account’s maximum allowed level, but at a level where expected drawdowns remain within psychologically and financially manageable bounds.
A useful target: structure your leverage and position sizing so that your maximum expected drawdown is less than 20% of account equity. This is achievable while still generating meaningful returns, and it keeps the account in the range where rational decision-making is possible.
Drawdown Limits in Professional Trading
At proprietary trading firms, drawdown limits are strictly enforced and non-negotiable. A typical structure:
- Daily loss limit: Stop trading for the day if you lose X% intraday (often 2-3%)
- Maximum drawdown: Soft limit at 5-8% (trigger a review); hard limit at 10-15% (trading is paused, strategy reviewed before resumption)
- Monthly loss limit: Often 5-8% — hitting this triggers a mandatory break and review
Retail traders should apply equivalent self-discipline. The hardest part: enforcing these rules on yourself when the natural impulse after a series of losses is to trade more aggressively to recover. This impulse leads to the exact opposite outcome.
Drawdown Duration: Recovery Time
The length of a drawdown period is as important as its depth. A 20% drawdown that recovers in 2 weeks is very different from a 20% drawdown that takes 18 months to recover. Long drawdown periods test psychological resilience far more than deep-but-brief ones.
When evaluating a trading strategy, look at both the depth and the duration of historical drawdown periods. A strategy with 15% maximum drawdown that lasted 9 months requires more confidence and capital stability to execute than one where the same 15% drawdown lasted 6 weeks.
Key Takeaways
- Drawdown measures peak-to-trough decline in account equity — the core measure of strategy risk
- Recovery math is asymmetric: a 50% drawdown requires 100% gain to recover
- Maximum drawdown under 20% of equity is a practical target for maintainable strategies
- Leverage amplifies drawdowns; size positions so expected drawdown stays within manageable range
- Both depth and duration of drawdown periods matter when evaluating a strategy
FAQ
What is a “normal” drawdown for forex trading? It depends heavily on the strategy. High-frequency scalping systems often have low absolute drawdowns (1-5%) because positions are held briefly. Trend-following systems can have drawdowns of 15-30% during choppy, range-bound market conditions but deliver returns during strong trending periods. There’s no universal “normal” — context matters.
Should I stop trading if I hit my maximum drawdown limit? Yes, temporarily. A pause during significant drawdown prevents the compounding mistakes that turn a bad period into a catastrophic one. Use the pause to review whether the drawdown represents normal strategy variance or a genuine breakdown in the market conditions the strategy was designed for.
Ready to trade forex?
Open a free demo account with a regulated broker. Practice with virtual funds before risking real money.