Earnings Calendar
An earnings calendar is a chronological schedule and financial tracking tool detailing the specific dates, times, and consensus analyst expectations for upcoming quarterly and annual corporate financial earnings releases across global equity markets.
What Is an Earnings Calendar?
An earnings calendar is an essential institutional trading schedule, quantitative data feed, and financial planning tool that catalogs the confirmed and estimated dates, release times, and consensus performance expectations for upcoming corporate earnings reports across exchange-listed companies worldwide.
In modern financial markets, earnings calendars serve as the primary operational roadmap for equity portfolio managers, algorithmic high-frequency trading (HFT) desks, event-driven hedge funds, and retail options traders. Because quarterly earnings releases introduce violent binary volatility into individual stock prices and broader equity indices (such as the S&P 500, Nasdaq 100, and DAX), tracking the chronological cadence of corporate earnings releases is mandatory for both risk mitigation and tactical volatility harvesting.
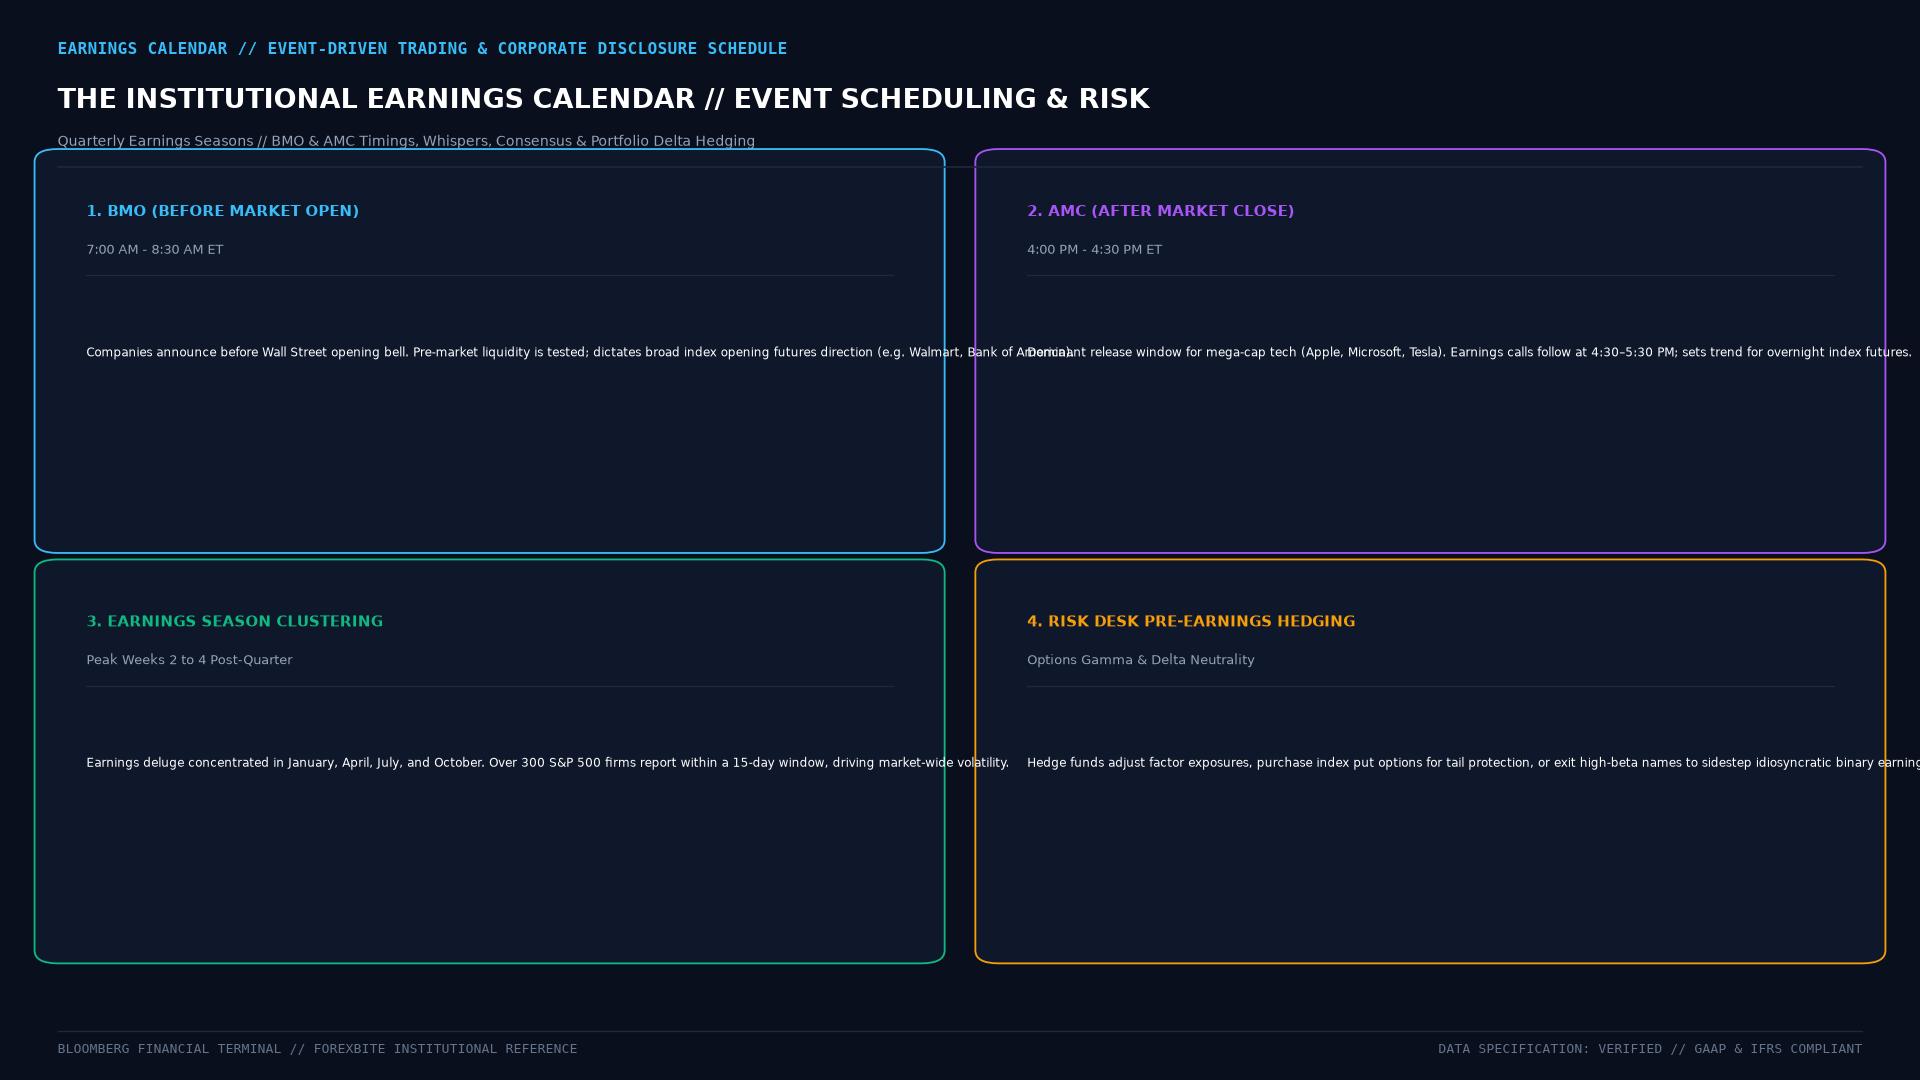 Figure: Structure of institutional earnings calendars, highlighting EPS consensus estimates, revenue expectations, implied options volatility, and systematic event-driven trading setups.
Technical Mechanics: Expected Move Derivation from Options
Institutional traders do not merely read an earnings calendar to know when a company reports; they cross-reference the calendar with real-time options chains to calculate the market-implied Expected Move ($\pm \Delta P$):
The At-The-Money (ATM) Straddle Approximation
The market’s consensus pricing of a stock’s volatility over its scheduled earnings release is derived by pricing the front-month At-The-Money (ATM) Call and Put options expiring immediately following the earnings date:
$$\text{Expected Dollar Move } (\pm $) \approx \text{Price}(\text{ATM Call}) + \text{Price}(\text{ATM Put})$$
$$\text{Expected Move Percentage } (\pm %) \approx \left( \frac{\text{ATM Straddle Cost}}{P_{\text{stock}}} \right) \times 0.85 \times 100$$
Where $P_{\text{stock}}$ is the current underlying spot price, and $0.85$ is a standard empirical adjustment factor accounting for the volatility smile and normal distribution tails.
If an earnings calendar flags that a $200 stock has an upcoming announcement on Thursday After Market Close, and its ATM Straddle is priced at $16.00:
$$\text{Expected Move} \approx \left( \frac{$16.00}{$200.00} \right) \times 0.85 \approx \pm 6.8%$$
Options market makers expect the stock to fluctuate within a range of $186.40 to $213.60 following the announcement.
The Four Quarterly Earnings Season Waves
Earnings calendars reflect a distinct seasonal quarterly rhythm across global equity markets:
| Earnings Season Wave | Primary Reporting Months | Traditional Bellwethers | Macroeconomic Significance |
|---|---|---|---|
| Q1 Earnings Wave | Mid-April to Late May | US Money-Center Banks (JPMorgan, Citi) | Sets full-year capital expenditure (CapEx) tone |
| Q2 Earnings Wave | Mid-July to Late August | Industrial Conglomerates, Big Tech | Mid-year economic health check |
| Q3 Earnings Wave | Mid-October to Late November | Tech Megacaps, Semi Manufacturers | Early insights into holiday consumer demand |
| Q4 / Full-Year Wave | Mid-January to Late February | Retailers, Automakers, Energy Giants | Audited 10-K filings, annual dividend resets |
Comparative Matrix: Financial Market Calendars
| Calendar Type | Focus Assets Tracked | Primary Volatility Catalysts | Typical Update Cadence |
|---|---|---|---|
| Earnings Calendar | Public corporate equities | Quarterly EPS, Revenue, Guidance | Massive 6-week quarterly bursts |
| Economic Calendar | Currencies, Sovereign Bonds, Gold | CPI, Non-Farm Payrolls, FOMC Rates | Daily / Continuous scheduled events |
| Dividend Calendar | Income stocks, Dividend Aristocrats | Ex-Dividend Dates, Record Dates | Monthly / Quarterly schedules |
| IPO Calendar | Private companies going public | Pricing dates, Offer sizes, Lockups | Sporadic, market-dependent |
Real-World Case Study: “Big Tech Super Thursday” (October 29, 2020)
The operational importance of monitoring earnings calendars was demonstrated during the historic Big Tech Super Thursday of October 2020.
Anatomy of an Earnings Calendar Collision:
1. The Scheduling Anomaly: Due to calendar clustering, four corporate titans—Apple (AAPL), Amazon (AMZN), Alphabet (GOOGL), and Facebook/Meta (META)—scheduled their Q3 earnings announcements on the exact same afternoon (October 29, 2020) at 16:05 EST.
2. The Scale: Together, these four companies represented over $5.5 trillion in market capitalization and roughly 25% of the total weighting of the Nasdaq 100 Index.
3. The Algorithmic Challenge: Between 16:00 and 16:15 EST, institutional quantitative engines processed four separate 60-page press releases simultaneously, parsing billions of data points.
4. The Market Impact: While Alphabet soared 8% on cloud revenue strength, Apple dropped 5% on delayed iPhone supply-chain remarks, causing violent cross-current volatility in index futures before stabilizing by the morning cash open.
Traders who monitored the earnings calendar had prepared for the liquidity shock by reducing directional leverage and trading market-neutral index strangles.
Frequently Asked Questions (FAQ)
Where do earnings calendar platforms source their scheduled dates?
Earnings calendar providers (such as Bloomberg, FactSet, Zacks, and Yahoo Finance) utilize two data collection streams. First, they scrape official corporate investor relations press releases where companies formally announce the date and time of their upcoming earnings calls. Second, prior to official corporate confirmation, quantitative algorithms forecast probable reporting dates based on historical reporting patterns (e.g., if a company historically reports on the third Thursday of October for ten consecutive years).
What does it mean when a company changes or delays its confirmed earnings date?
A last-minute date change on an earnings calendar is an institutional red flag. While occasionally caused by benign administrative delays or software migrations, empirical academic research shows that companies that unexpectedly delay their confirmed earnings announcements are statistically far more likely to report severe earnings misses, accounting irregularities, auditor disputes, or executive resignations.
How do foreign exchange (forex) traders utilize an equity earnings calendar?
While forex traders focus primarily on macroeconomic indicators (such as central bank interest rate decisions and CPI inflation), large-cap equity earnings seasons exert a major indirect influence on currency pairs. Disastrous earnings from major US technology conglomerates can trigger broad risk aversion, prompting international capital to liquidate emerging market currencies and seek safety in the safe-haven US Dollar (USD) or Japanese Yen (JPY).
Ready to trade forex?
Open a free demo account with a regulated broker. Practice with virtual funds before risking real money.