Earnings Estimate (Analyst Consensus)
An earnings estimate is a forward-looking financial projection formulated by Wall Street equity research analysts estimating a corporation's future quarterly or annual earnings per share (EPS) and revenue.
What Is an Earnings Estimate?
In fundamental equity research and institutional asset management, an earnings estimate is a rigorous, quantitative forecast of a publicly traded corporation’s future quarterly or annual financial performance—principally measured in terms of Diluted Earnings Per Share (EPS) and gross revenue.
Earnings estimates are published by licensed financial analysts working for sell-side investment banks (such as Goldman Sachs, Morgan Stanley, and J.P. Morgan) and independent equity research boutiques. Financial data aggregators (including Bloomberg, FactSet, and Refinitiv/IBES) collect, normalize, and mathematically aggregate these individual analyst projections to establish the official benchmark known across global trading desks as the Consensus Estimate.
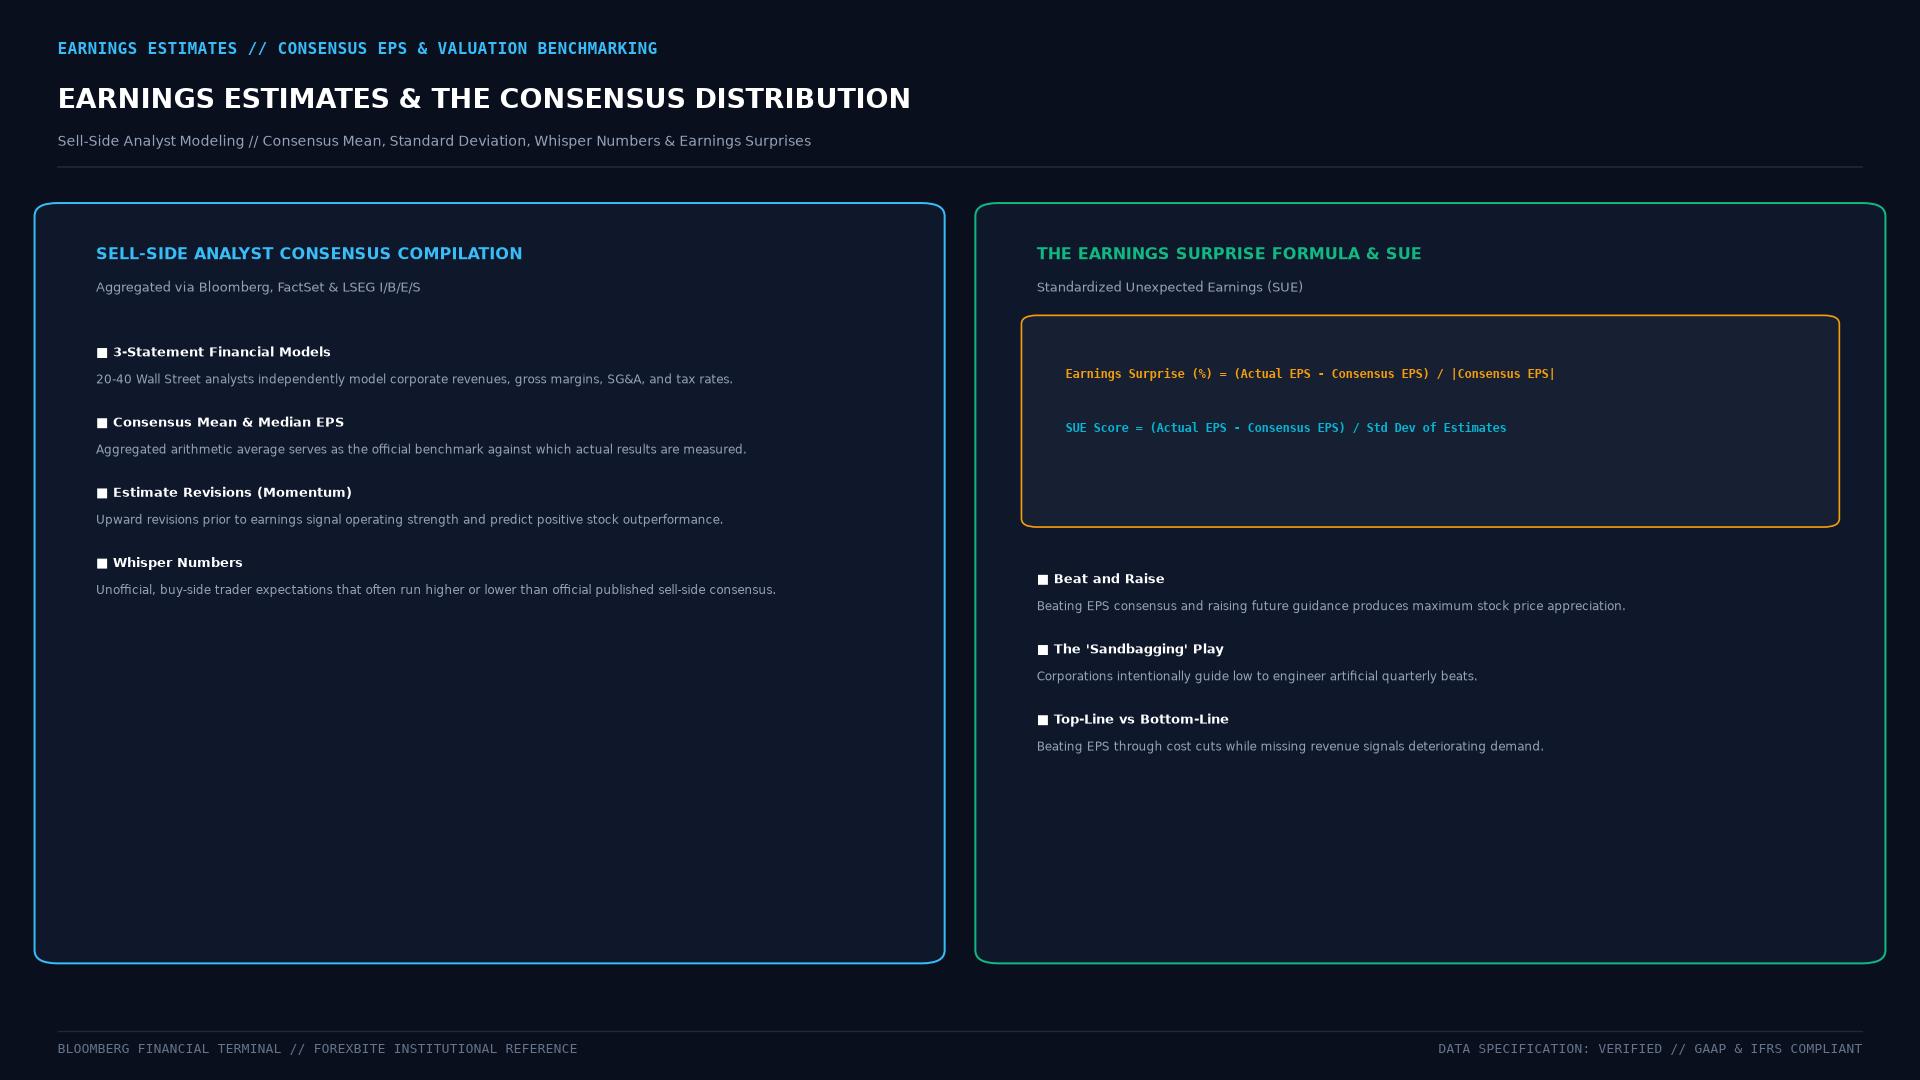 Figure: Sell-side consensus earnings estimate modeling, showing analyst forecast dispersion, standard deviation, and the Earnings Revision Ratio (ERR) as a leading factor for equity price momentum.
Technical Mechanics & Consensus Aggregation Mathematics
Financial data platforms calculate consensus metrics using strict statistical models:
1. Consensus Mean & Median EPS Formulation
For a stock tracked by $N$ independent equity research analysts:
$$\text{Consensus Mean EPS } (\bar{E}) = \frac{1}{N} \sum_{i=1}^{N} \text{EPS}_i$$
Where $\text{EPS}_i$ is the forecasted quarterly diluted EPS from analyst $i$. Data platforms frequently filter out stale forecasts that have not been updated within the preceding 30 days.
2. Analyst Estimate Dispersion
Analyst dispersion measures the degree of disagreement or uncertainty across Wall Street:
$$\text{Dispersion } (\sigma) = \sqrt{\frac{1}{N - 1} \sum_{i=1}^{N} \left( \text{EPS}_i - \bar{E} \right)^2}$$
Empirical market microstructure studies reveal that stocks exhibiting high estimate dispersion suffer significantly greater post-announcement price volatility than stocks with tight consensus agreement.
3. Percentage Earnings Surprise Formula
When the company reports its official quarterly print ($E_{\text{actual}}$), the earnings surprise is quantified as:
$$\text{Earnings Surprise %} = \left( \frac{E_{\text{actual}} - \bar{E}}{|\bar{E}|} \right) \times 100$$
A reported EPS of $2.30 against a consensus mean of $2.15 generates a +6.98% positive earnings surprise.
Corporate Guidance & The “Sandbagging” Phenomenon
The interaction between corporate executive management and sell-side analysts has created a well-documented behavioral dynamic known as guidance management or “sandbagging”:
The Corporate Guidance Expectation Cycle:
1. Executive Management sets internal financial targets for Q3 EPS at $2.20.
2. In public investor presentations, management issues conservative forward guidance of $2.00 to $2.05 ("sandbagging" the outlook).
3. Wall Street analysts trim their models, settling on a Consensus Estimate of $2.04.
4. On earnings day, the company reports $2.18, delivering an apparent "+6.8% Earnings Beat."
5. Financial media headlines praise the company for "crushing Wall Street expectations," driving initial algorithm buying.
To see through this corporate game, institutional hedge funds track the informal, unofficial Whisper Number—the true internal consensus traded among institutional buy-side portfolio managers.
Comparative Matrix: Forward Projection Types
| Projection Type | Source / Author | Transparency Level | Purpose in Market |
|---|---|---|---|
| Sell-Side Consensus | Aggregated Wall Street brokers | Public / Standardized (Bloomberg) | Baseline benchmark for algorithmic trading |
| Management Guidance | Corporate CEO & CFO | Publicly disclosed (Safe Harbor) | Corporate expectation anchor |
| Buy-Side Whisper Number | Institutional hedge fund desks | Private / Informal | True institutional positioning baseline |
| Independent Quant Model | Machine learning / Alternative data | Proprietary internal | Alpha generation / Front-running consensus |
Real-World Case Study: Nvidia’s Historic AI Consensus Crushes (2023–2024)
The extraordinary market impact of shattering Wall Street earnings estimates was demonstrated by semiconductor giant Nvidia (NVDA) during the artificial intelligence boom.
Anatomy of an Unprecedented Estimate Inversion:
1. The Q1 2024 Setup (May 2023): Wall Street consensus estimates projected Q2 revenue of $7.15 billion.
2. The Guidance Shock: During its earnings announcement, Nvidia stunned markets by issuing Q2 revenue guidance of $11.00 billion (a mind-boggling 54% above consensus), citing insatiable demand for H100 AI chips.
3. The Print (August 2023): Nvidia reported actual Q2 revenue of $13.51 billion and EPS of $2.70 (crushing the already elevated consensus of $2.08 by 30%).
4. The Market Reaction:
   * Wall Street analysts were forced to execute emergency, massive upward revisions across their valuation models, doubling forward 12-month earnings targets overnight.
   * Nvidia shares surged over 240% in 2023, proving that monumental positive earnings surprises drive sustained institutional re-ratings.
Frequently Asked Questions (FAQ)
What causes analysts to revise their earnings estimates between reporting seasons?
Sell-side analysts revise earnings estimates based on several dynamic catalysts:
- Corporate Mid-Quarter Updates: Management issuing updated guidance at industry investor conferences.
- Alternative Data Feeds: Proprietary credit card transaction tracking, satellite imagery of store parking lots, or supply-chain channel checks showing surging or deteriorating product demand.
- Macroeconomic Shifts: Sudden swings in foreign exchange rates, benchmark interest rates, or raw material commodity input costs.
What is the difference between a Sell-Side analyst and a Buy-Side analyst?
A sell-side analyst works for an investment bank or brokerage firm (such as Morgan Stanley). Their research and earnings estimates are published publicly and distributed to institutional clients to generate trading commissions and investment banking relationships. A buy-side analyst works directly for an institutional asset manager (such as a hedge fund, mutual fund, or pension fund). Their earnings models are strictly proprietary and kept secret to provide the fund with a competitive alpha edge.
Why do some companies consistently “beat” earnings estimates quarter after quarter?
Companies with sophisticated investor relations departments intentionally manage Wall Street expectations downward. By guiding analysts to conservative forecasts that the company knows it can easily surpass, management ensures a steady string of quarterly earnings “beats.” This builds retail investor confidence, prevents negative headline shocks, and preserves the stock’s valuation multiple over time.
Ready to trade forex?
Open a free demo account with a regulated broker. Practice with virtual funds before risking real money.