Earnings Growth
Earnings growth is the percentage change in a corporation's net income or diluted earnings per share (EPS) over a specific comparative accounting period, serving as the primary driver of long-term equity valuations and the central variable in discounted cash flow models.
What Is Earnings Growth?
In corporate finance, growth equity investing, and fundamental valuation analysis, earnings growth measures the percentage change in a corporation’s reported net income or diluted Earnings Per Share (EPS) between two comparable accounting periods—typically year-over-year (YoY) or quarter-over-quarter (QoQ).
Among all the fundamental financial metrics tracked by institutional asset managers, sell-side equity analysts, and global macro hedge funds, earnings growth is widely regarded as the single most powerful long-term determinant of equity market returns and individual stock price appreciation.
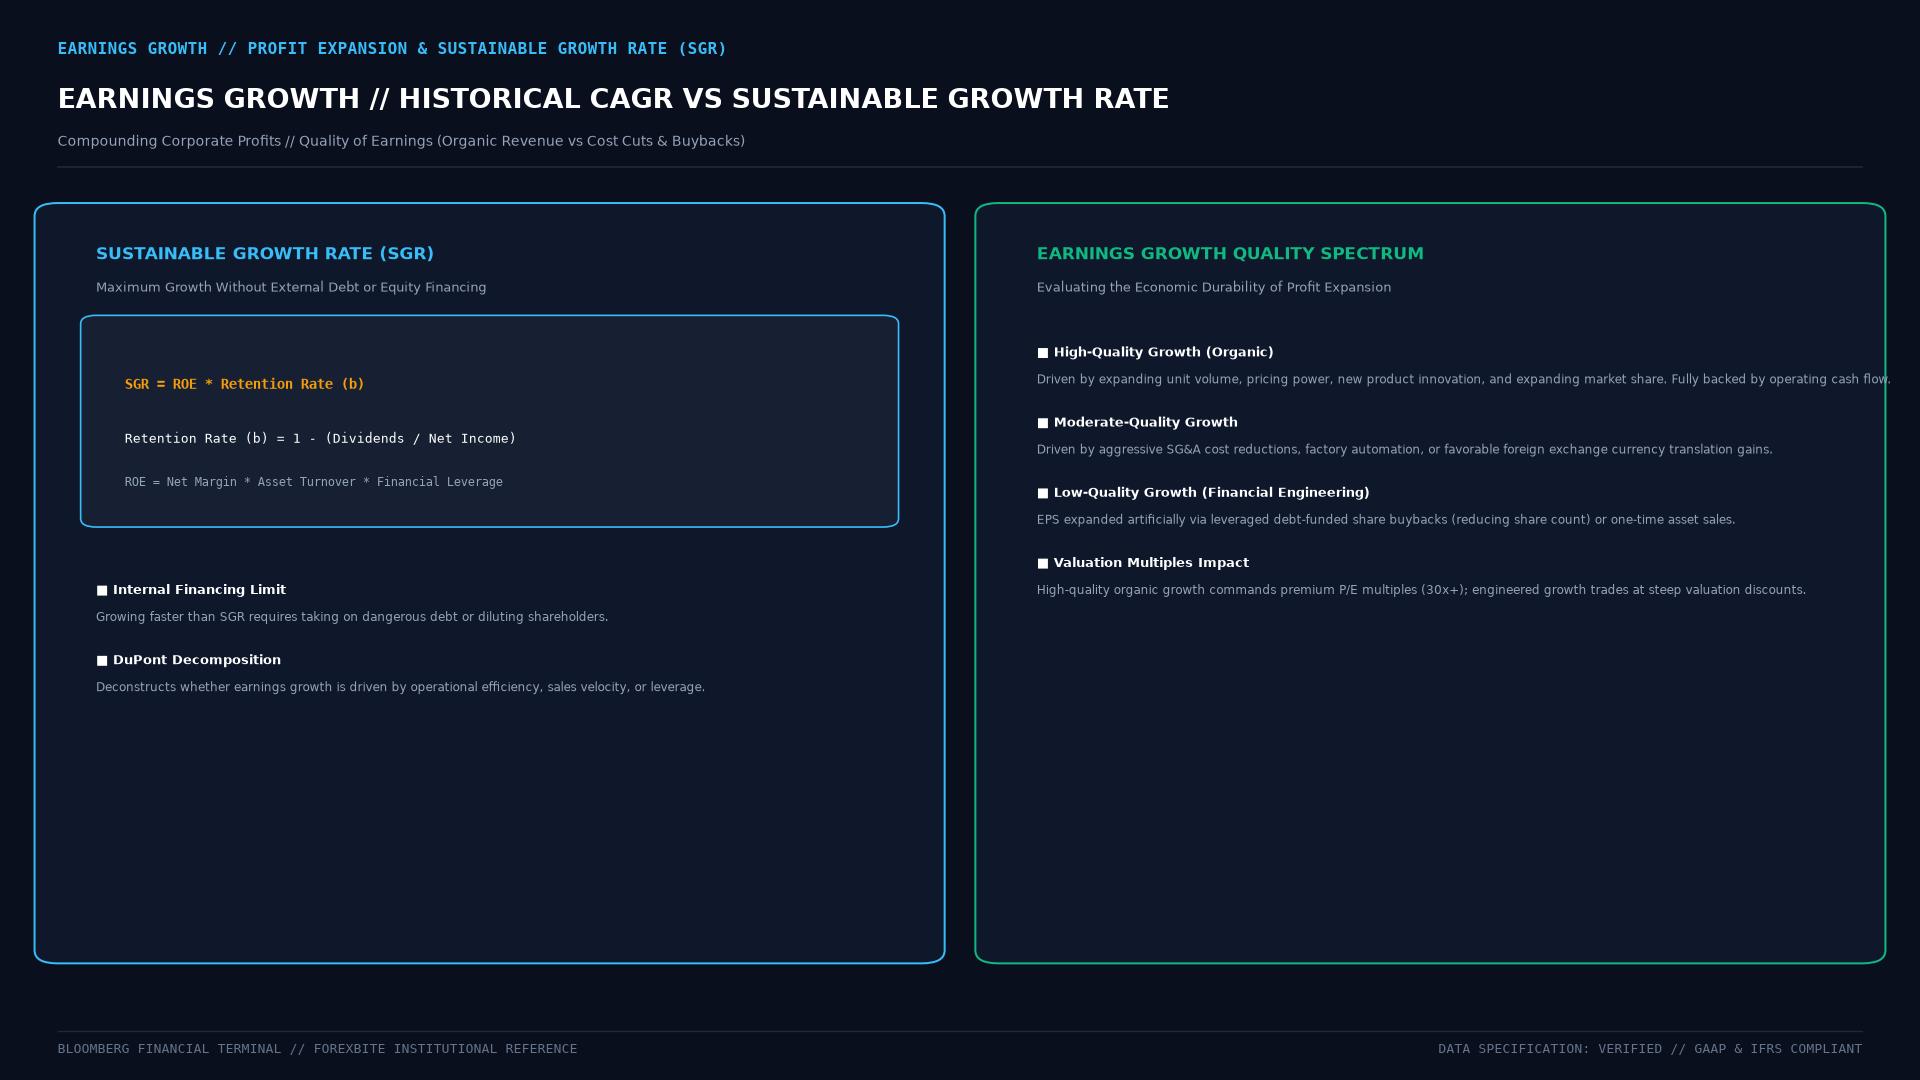 Figure: Multi-year corporate earnings growth trajectories comparing high-growth expansion with mature cash cows, sustainable growth rate ($SGR = ROE \times b$), and Price/Earnings-to-Growth (PEG) valuation dynamics.
Technical Mechanics & Valuation Integration
1. Basic Earnings Growth Rate Formulas
$$\text{YoY Earnings Growth} = \left( \frac{\text{EPS}{\text{current year}} - \text{EPS}{\text{prior year}}}{\left| \text{EPS}_{\text{prior year}} \right|} \right) \times 100$$
$$\text{Compound Annual Growth Rate (CAGR)} = \left( \frac{\text{EPS}{\text{final year}}}{\text{EPS}{\text{base year}}} \right)^{\frac{1}{n}} - 1$$
2. The PEG Ratio (Price / Earnings to Growth)
The PEG Ratio — popularized by Peter Lynch in his landmark 1989 investment tome One Up on Wall Street — normalizes a company’s valuation multiple by its earnings growth rate:
$$\text{PEG Ratio} = \frac{\text{Price-to-Earnings Ratio (P/E)}}{\text{Forward Earnings Growth Rate (%})}$$
- PEG Ratio $< 1.0$: The stock is potentially undervalued relative to its earnings growth trajectory.
- PEG Ratio $= 1.0$: The market is fairly valuing the growth rate.
- PEG Ratio $> 2.0$: The stock is pricing in elevated optimism; future growth must accelerate or the share price will correct.
3. Gordon Growth Model (Dividend Discount Model)
In the simplest closed-form equity valuation model, sustainable earnings growth ($g$) directly drives intrinsic stock value:
$$P = \frac{D_1}{k - g} = \frac{\text{EPS}_1 \times \text{Payout Ratio}}{k - g}$$
Where $k$ is the required rate of return and $g$ is the long-run sustainable earnings growth rate.
Sustainable vs. Unsustainable Earnings Growth
| Growth Source | Sustainability | Investor Signal | Common Examples |
|---|---|---|---|
| Organic Revenue Expansion | High (5 to 10+ years) | Strongest positive signal | Pricing power, market share wins |
| Operating Leverage | Medium (3 to 5 years) | Positive (scale benefits) | Fixed cost absorption on revenue expansion |
| Margin Expansion | Medium | Positive (efficiency gains) | Supply chain optimization, automation |
| Share Buybacks | Low to Medium | Neutral (financial engineering) | Reduces share count; boosts EPS mechanically |
| Acquisitive Growth (M&A) | Low | Depends on integration | Debt-financed deals can destroy long-run EPS |
| Tax Rate Reduction | Very Low (one-time) | Neutral | US Tax Cuts & Jobs Act (2017) windfall |
Real-World Case Study: Nvidia’s AI-Driven Earnings Explosion (2023–2024)
The most dramatic documented surge in corporate earnings growth in modern financial market history was produced by semiconductor manufacturer Nvidia Corporation (NVDA).
Anatomy of a Hyper-Growth Earnings Cycle:
- Fiscal Year 2023 (Ending January 2023):
  * Net Income: $4.37 Billion.
  * Diluted EPS: $1.74.
- Fiscal Year 2024 (Ending January 2024):
  * Net Income: $29.76 Billion (+581% YoY Growth).
  * Diluted EPS: $11.93 (+586% YoY Growth).
- Fiscal Year 2025 (Ending January 2025):
  * Net Income: $72.88 Billion (+145% YoY Growth).
  * Diluted EPS: $2.94 on a post-split basis.

The Market's Response: Nvidia's 3-year CAGR in earnings exceeded 315%. The stock's market capitalization surged from roughly $300 billion in early 2023 to over $3.5 trillion by mid-2024 — a 10x+ increase — as the market re-rated the stock from a mature semiconductor company to an AI infrastructure monopoly, justifying a PEG ratio expansion.
Frequently Asked Questions (FAQ)
Why does a high-growth company often trade at a P/E ratio of 40x to 60x while a slow-growth company trades at 10x?
Equity valuations are forward-looking. A company growing earnings at 30% annually will double its EPS roughly every 2.5 years. A patient investor paying 50x today’s earnings will effectively be paying just 12.5x the earnings of five years in the future. Conversely, a company with near-zero earnings growth offers no mathematical path to compress its P/E through time, justifying only modest valuation multiples.
What is the “Rule of 40” used by SaaS investors?
Popular in software-as-a-service (SaaS) venture capital and growth equity circles, the Rule of 40 states that a healthy SaaS business must maintain a combined Revenue Growth Rate % + Operating Profit Margin % ≥ 40%. For example, a SaaS company growing revenue at 50% while operating at a -20% margin scores 30% (failing the test), whereas one growing at 25% with a +20% margin scores 45% (passing).
Can earnings growth be negative and still signal a buying opportunity?
Absolutely. Corporate earnings frequently turn negative (contracting) during macroeconomic recessions, commodity price crashes, or industry restructuring cycles. Contrarian value investors and private equity firms specifically target companies with temporarily depressed earnings because, as the business cycle normalizes, earnings typically rebound sharply — creating massive percentage earnings growth and explosive stock price appreciation from cyclically depressed valuation multiples.
Ready to trade forex?
Open a free demo account with a regulated broker. Practice with virtual funds before risking real money.