Earnings (Net Income / Bottom Line)
Earnings (conventionally designated as net income or the 'bottom line') represents the net profit generated by a business corporation over an accounting period after deducting all costs of goods sold, operating expenses, depreciation, interest, and taxes.
What Are Corporate Earnings?
In fundamental equity analysis, financial accounting, and corporate finance, earnings—universally synonymous with net income or the “bottom line”—represents the residual profit that remains for a corporation’s equity shareholders after all operating costs, raw material expenses, employee salaries, debt interest payments, depreciation write-offs, and sovereign corporate income taxes have been fully subtracted from gross revenue.
Corporate earnings represent the single most important fundamental variable governing equity valuations. Over long investment horizons, a company’s stock price tracks the present discounted value of its future earnings stream. Every quarter, publicly traded companies release certified earnings reports, triggering intense volatility across global stock exchanges as investors compare reported financial performance against consensus Wall Street estimates.
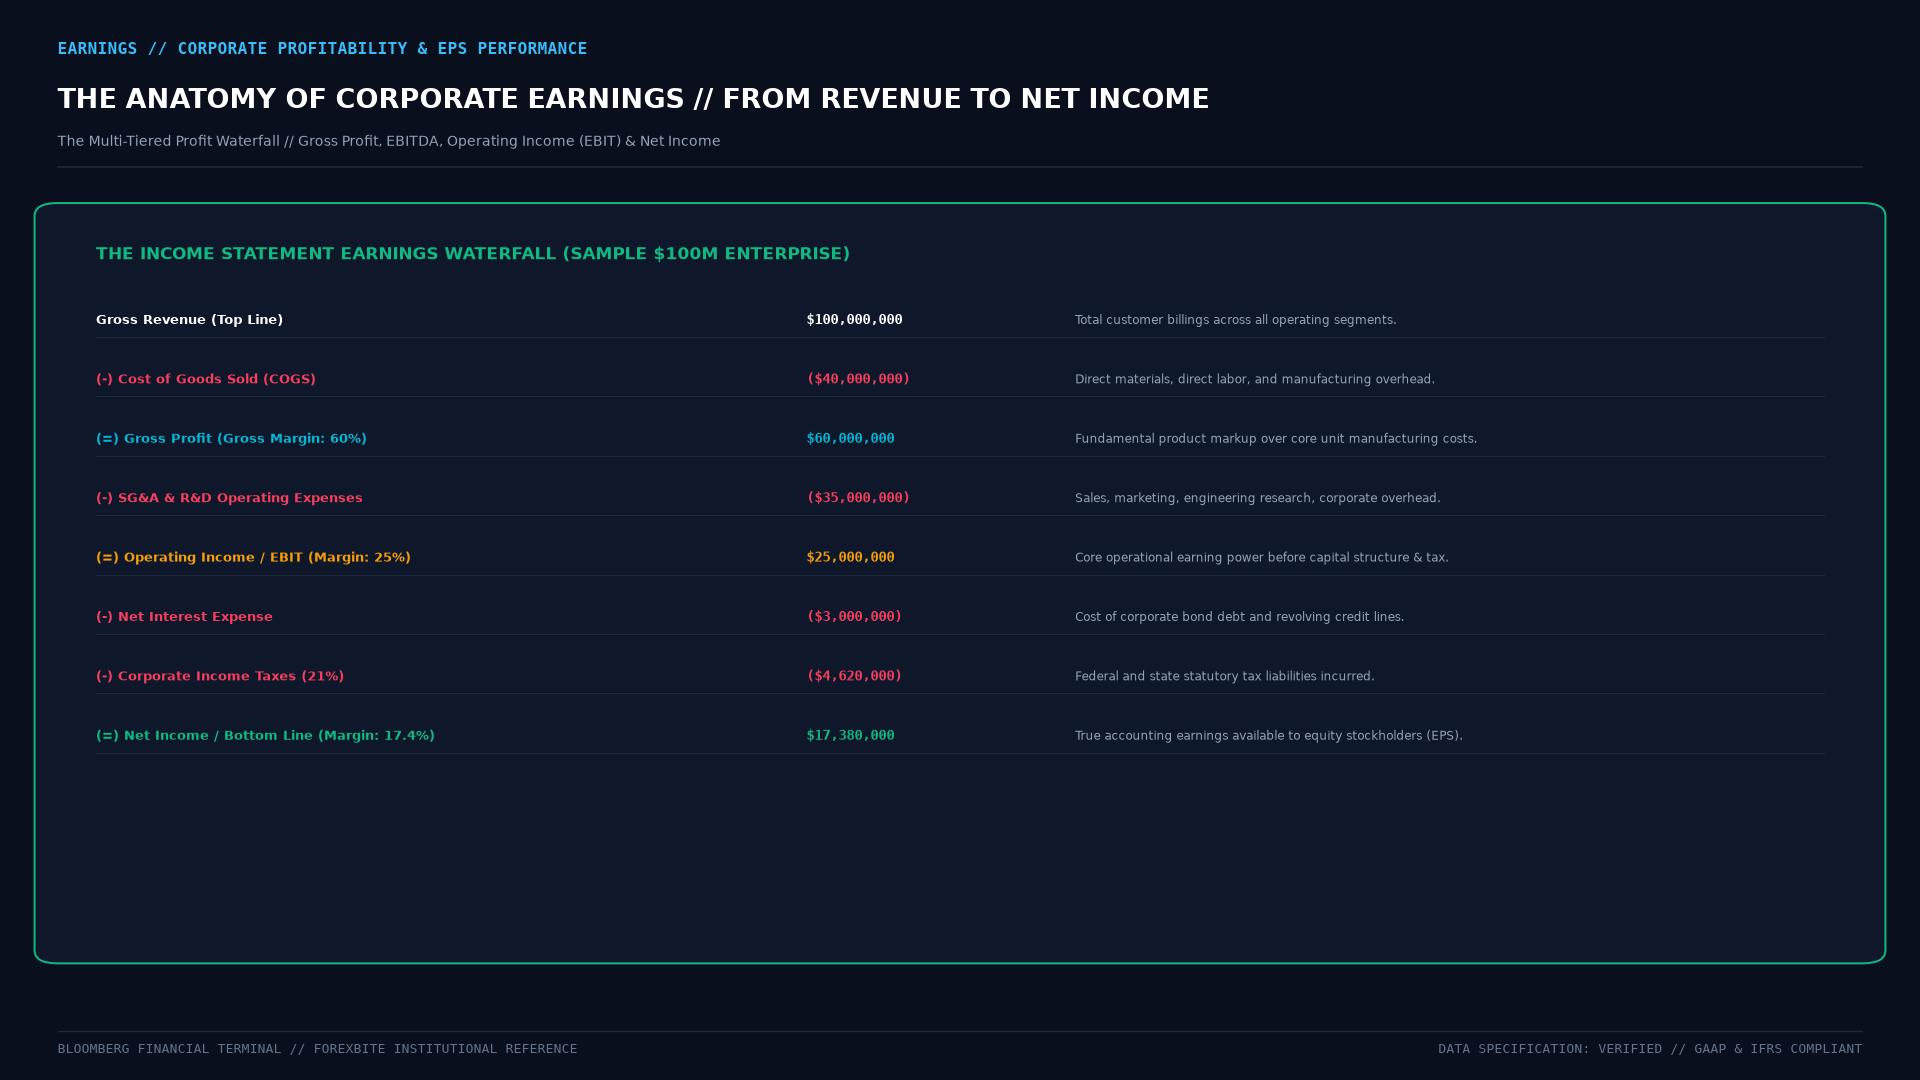 Figure: The corporate income statement earnings waterfall from Gross Revenue through Operating Profit (EBIT), Pre-Tax Income (EBT), Net Income, and Diluted Earnings Per Share (EPS).
Technical Mechanics & Fundamental Valuation Ratios
In financial modeling, corporate earnings are translated into per-share and valuation multiples:
1. Earnings Per Share (EPS) Formulations
To determine the earnings attributable to each individual share of common stock:
$$\text{Basic EPS} = \frac{\text{Net Income} - \text{Preferred Stock Dividends}}{\text{Weighted Average Common Shares Outstanding}}$$
$$\text{Diluted EPS} = \frac{\text{Net Income} - \text{Preferred Dividends} + \text{Convertible Adjustments}}{\text{Weighted Average Common Shares} + \text{Dilutive Warrants, Options, & Convertibles}}$$
Institutional investors prioritize Diluted EPS because it factors in the potential dilution from executive stock option grants and convertible debt instruments.
2. Price-to-Earnings Ratio (P/E Multiple)
The P/E ratio measures how much investors are willing to pay for each $1.00 of current corporate earnings:
$$\text{P/E Ratio} = \frac{P_{\text{share}}}{\text{Diluted EPS}}$$
A company trading at a P/E of 25 implies an Earnings Yield ($E/P$) of 4.0% ($1/25 = 0.04$).
GAAP Earnings vs. Non-GAAP (Adjusted) Earnings
Corporate earnings reporting has bifurcated into two distinct metrics:
| Metric Type | Governing Accounting Standard | Treatment of Stock-Based Comp | Treatment of One-Off Restructuring | Primary Use Case |
|---|---|---|---|---|
| GAAP Net Income | Strict US GAAP / SEC rules | Fully expensed as operating cost | Fully expensed against earnings | Legal compliance, SEC Form 10-K |
| Non-GAAP (Adjusted) Earnings | Discretionary corporate definition | Added back to earnings (+) | Added back to earnings (+) | Wall Street analyst consensus |
| EBITDA | Cash operating proxy | Excluded | Excluded | Private equity debt capacity |
| Free Cash Flow (FCF) | Cash flow from operations minus CapEx | Non-cash; adjusted on Cash Flow Stmt | Cash charges deducted | M&A discounted cash flow (DCF) models |
In technology and biotechnology equities, corporate management routinely reports Non-GAAP “Adjusted Earnings” that are significantly higher than official GAAP Net Income by adding back non-cash stock-based compensation (SBC), a practice that requires forensic scrutiny by fundamental investors.
Real-World Case Study: The Enron Accounting Collapse (2001)
The most infamous manipulation of corporate earnings in history occurred during the downfall of energy trading giant Enron Corporation.
Anatomy of an Earnings Illusion:
1. The Loophole: In 1992, the SEC permitted Enron to use "Mark-to-Market" (MTM) accounting for its long-term forward energy contracts.
2. The Manipulation: Under CEO Jeffrey Skilling, Enron booked the estimated future net present value of 20-year energy contracts as immediate, current-quarter earnings on the day the deal was signed. If real-world cash flows fell short years later, Enron transferred the losing assets into off-balance-sheet Special Purpose Entities (SPEs) like Chewco and LJM.
3. The Mirage: Enron reported record-shattering earnings growth every quarter, while its actual operating cash flow was deeply negative.
4. The Collapse: When whistleblower Sherron Watkins exposed the debt-hiding entities in late 2001, Enron was forced to restate billions in prior earnings, wiping out $60 billion in equity market value and triggering the immediate bankruptcy of the firm and the dissolution of auditor Arthur Andersen.
The scandal led directly to the passage of the Sarbanes-Oxley Act of 2002 (SOX), mandating that corporate CEOs and CFOs personally sign off on the accuracy of financial earnings reports under threat of criminal prosecution.
Frequently Asked Questions (FAQ)
What is the difference between revenue (top line) and earnings (bottom line)?
Revenue (the top line) is the total dollar value of all goods and services sold to customers before any costs or expenses are deducted. Earnings (the bottom line) is what remains after every single expense—including cost of goods sold, salaries, marketing, research, bond interest, depreciation, and corporate taxes—has been paid. A company can generate $100 billion in gross revenue but still produce negative earnings (a net loss) if its operating costs exceed sales.
Why do stock prices frequently fall even after a company reports record-high earnings?
Stock prices do not react merely to whether earnings are high in absolute terms; they react to whether earnings beat or miss market expectations. If Wall Street analysts anticipated that a tech giant would earn $2.50 per share, and the company reports a record $2.40 per share, the stock will often plunge because the company “missed consensus.” Furthermore, stock prices are forward-looking: if management pairs record quarterly earnings with weak forward guidance for the next quarter, investors will sell the stock immediately.
What is the difference between Trailing P/E and Forward P/E?
Trailing P/E (P/E TTM) calculates the price-to-earnings ratio using the company’s actual, verified earnings per share over the past twelve months. Forward P/E calculates the ratio using consensus Wall Street analyst forecasts of what the company is projected to earn over the next twelve months. Forward P/E is heavily favored by growth stock investors, but carries the risk that analyst projections may prove overly optimistic.
Ready to trade forex?
Open a free demo account with a regulated broker. Practice with virtual funds before risking real money.