Fair Value Gap
In technical analysis and Smart Money Concepts (SMC), a Fair Value Gap (FVG) is a three-candlestick market structure pattern resulting from aggressive institutional displacement that leaves a unilateral price inefficiency or liquidity imbalance between the wicks of the first and third candles.
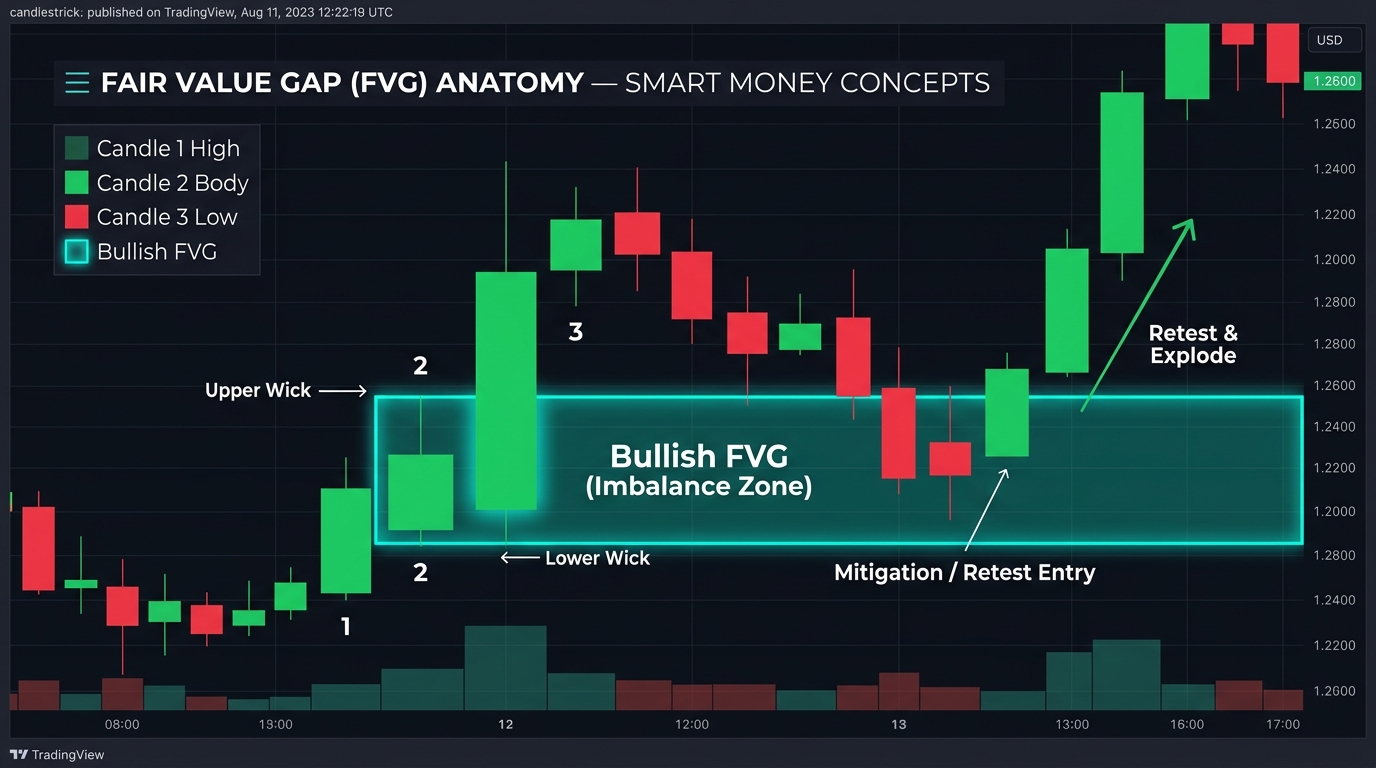
What Is a Fair Value Gap (FVG)?
In technical analysis, algorithmic order flow theory, and Smart Money Concepts (SMC), a Fair Value Gap (FVG) represents an institutional price imbalance or liquidity void. It occurs when aggressive, high-volume buying or selling creates a rapid displacement on the price chart, leaving a zone where trading was strictly one-sided.
Unlike a traditional market gap (which occurs between trading sessions when opening prices jump past closing prices), a Fair Value Gap forms within continuous intra-day or daily candlestick sequences. In an efficient two-sided market, the wicks of adjacent candles overlap to ensure bilateral trade execution across all tick levels. When an aggressive displacement occurs, a three-candle sequence emerges where the wicks of Candle 1 and Candle 3 fail to meet, leaving an unfilled void inside Candle 2.
Interbank algorithmic execution models (such as IPDA—Interbank Price Delivery Algorithm) frequently treat FVGs as dynamic magnets, pulling prices back into the gap to restore market equilibrium, fill unfilled institutional limit orders, and balance historical order flow before continuing the prevailing trend.
+-------------------------------------------------------------------------+
|                  FAIR VALUE GAP (FVG) ANATOMY                           |
+-------------------------------------------------------------------------+
|                                                                         |
|       BULLISH FAIR VALUE GAP                 BEARISH FAIR VALUE GAP     |
|                                                                         |
|          Candle 3                              Candle 1                 |
|           [   ]                                 [   ]                   |
|           |   | Low (C3)                        |   |                   |
|           +---+                                 +---+ Low (C1)          |
|      ===================                   ===================          |
|      |    FVG IMBALANCE|                   |   FVG IMBALANCE |          |
|      |  (Consequent    |                   | (Consequent     |          |
|      |  Encroachment)  |                   | Encroachment)   |          |
|      ===================                   ===================          |
|           +---+ High (C1)                       +---+ High (C3)         |
|           |   |                                 |   |                   |
|           [   ]                                 [   ]                   |
|          Candle 1                              Candle 3                 |
|                                                                         |
|      Candle 2: Large Bullish Body          Candle 2: Large Bearish Body |
|      Displacement candle leaving           Displacement candle leaving  |
|      unfilled liquidity void.              unfilled liquidity void.     |
+-------------------------------------------------------------------------+
Technical Mechanics & Geometric Calculation
A Fair Value Gap is mathematically defined strictly across a continuous three-candlestick sequence:
1. Bullish FVG Geometry
A bullish FVG forms during an aggressive upward impulse where: $$\text{Low of Candle 3} > \text{High of Candle 1}$$ The price range of the imbalance spans: $$\text{FVG}{\text{Bullish}} = \left[ \text{High}{\text{Candle 1}}, ; \text{Low}_{\text{Candle 3}} \right]$$
2. Bearish FVG Geometry
A bearish FVG forms during an aggressive downward impulse where: $$\text{High of Candle 3} < \text{Low of Candle 1}$$ The price range of the imbalance spans: $$\text{FVG}{\text{Bearish}} = \left[ \text{High}{\text{Candle 3}}, ; \text{Low}_{\text{Candle 1}} \right]$$
3. Consequent Encroachment (C.E.)
The exact 50% median line of the Fair Value Gap is termed the Consequent Encroachment (C.E.): $$\text{C.E.} = \text{Low}{\text{FVG}} + 0.50 \times \left(\text{High}{\text{FVG}} - \text{Low}_{\text{FVG}}\right)$$ Traders watch the C.E. level closely: institutional order flow algorithms often defend this 50% midpoint. A candle body closing beyond C.E. signals structural weakness in the gap.
Comparative Matrix: Order Flow Inefficiencies
| Imbalance Pattern | Identification Structure | Session Timing | Retest Probability | Primary Execution Role |
|---|---|---|---|---|
| Fair Value Gap (FVG) | 3-candle sequence; gap between C1 and C3 wicks | Intra-day or daily continuous chart | Very High (80%+) | High-probability entry on pullback / mitigation |
| Traditional Gap | Space between previous session close & open | Overnight market open / weekend | High | Breakaway, exhaustion, or runaway momentum |
| Volume Imbalance | Real bodies don’t overlap, but wicks do overlap | News catalysts, sudden volatility | Moderate | Immediate price delivery rebalancing |
| Liquidity Void | Long series of consecutive one-sided candles | Macro trend acceleration / breakouts | Eventual | Macro target for multi-day mean reversion |
Real-World Trading Case Study: EUR/USD London Session Rebalancing
During a European Central Bank (ECB) monetary policy statement, institutional order flow generated a classic FVG setup on the 15-minute EUR/USD chart:
- The Displacement: At 14:15 GMT, EUR/USD surged 65 pips in a massive bullish candle (Candle 2). Candle 1 topped out at 1.0840, while Candle 3 established a subsequent swing low at 1.0872.
- The FVG Formulation: An unfilled 32-pip bullish Fair Value Gap formed between 1.0840 and 1.0872, with a Consequent Encroachment (50% midpoint) at 1.0856.
- The Mitigation Entry: During the New York morning session (15:30 GMT), price retraced lower into the London imbalance. Price pierced the top of the FVG at 1.0872, wicked down precisely to 1.0855 (testing Consequent Encroachment within 1 pip), and printed a bullish hammer.
- The Outcome: The algorithmic order block absorbed retail sell orders, launching EUR/USD into a secondary rally to 1.0920, providing a 4.5:1 reward-to-risk ratio trade for entry off the FVG mitigation.
Frequently Asked Questions (FAQ)
Does every Fair Value Gap need to be filled?
No. While markets have an algorithmic tendency to rebalance price inefficiencies, strong trend runs (“runaway trends”) can leave FVGs unmitigated for days, weeks, or indefinitely. FVGs aligned with higher-timeframe market structure possess the highest fill-and-reversal reliability.
What is the difference between an Inversion Fair Value Gap (IFVG) and a standard FVG?
When price retraces into a standard FVG and blows completely through it with a full candle body close (failing to respect it as support or resistance), the FVG is considered violated. In SMC theory, it flips into an Inversion Fair Value Gap (IFVG), acting as opposite resistance or support on future retests.
Which timeframe is best for trading Fair Value Gaps?
FVGs are fractal and appear on all timeframes from the 1-minute chart up to monthly charts. Professional institutional traders use Higher Timeframe (HTF) FVGs (Daily and 4-Hour) to establish directional bias, and Lower Timeframe (LTF) FVGs (5-minute and 1-minute) for precision entry triggers.
Ready to trade forex?
Open a free demo account with a regulated broker. Practice with virtual funds before risking real money.