Fibonacci Numbers
Fibonacci numbers are a mathematical sequence where each number is the sum of the two preceding ones: 0, 1, 1, 2, 3, 5, 8, 13, 21, 34... The ratios between these numbers — particularly 61.8%, 38.2%, and 23.6% — appear consistently in financial markets as retracement and extension levels that traders use to identify potential support, resistance, and price targets.
The Math Behind the Markets
The Fibonacci sequence was introduced to the Western world by Italian mathematician Leonardo of Pisa — nicknamed Fibonacci — in his 1202 work Liber Abaci. He wasn’t writing about financial markets. He was solving a problem about rabbit population growth. The sequence he described (0, 1, 1, 2, 3, 5, 8, 13, 21, 34, 55, 89, 144…) became one of the most observed patterns in nature: sunflower seed spirals, nautilus shells, galaxy formations.
What brought it into trading: each number in the sequence, divided by the number immediately following it, approaches 0.618 — the Golden Ratio, also written as φ (phi). Dividing any number by the one two positions ahead approaches 0.382. These ratios and their derivatives appear in price charts with enough consistency that major financial institutions incorporate them into their technical analysis frameworks.
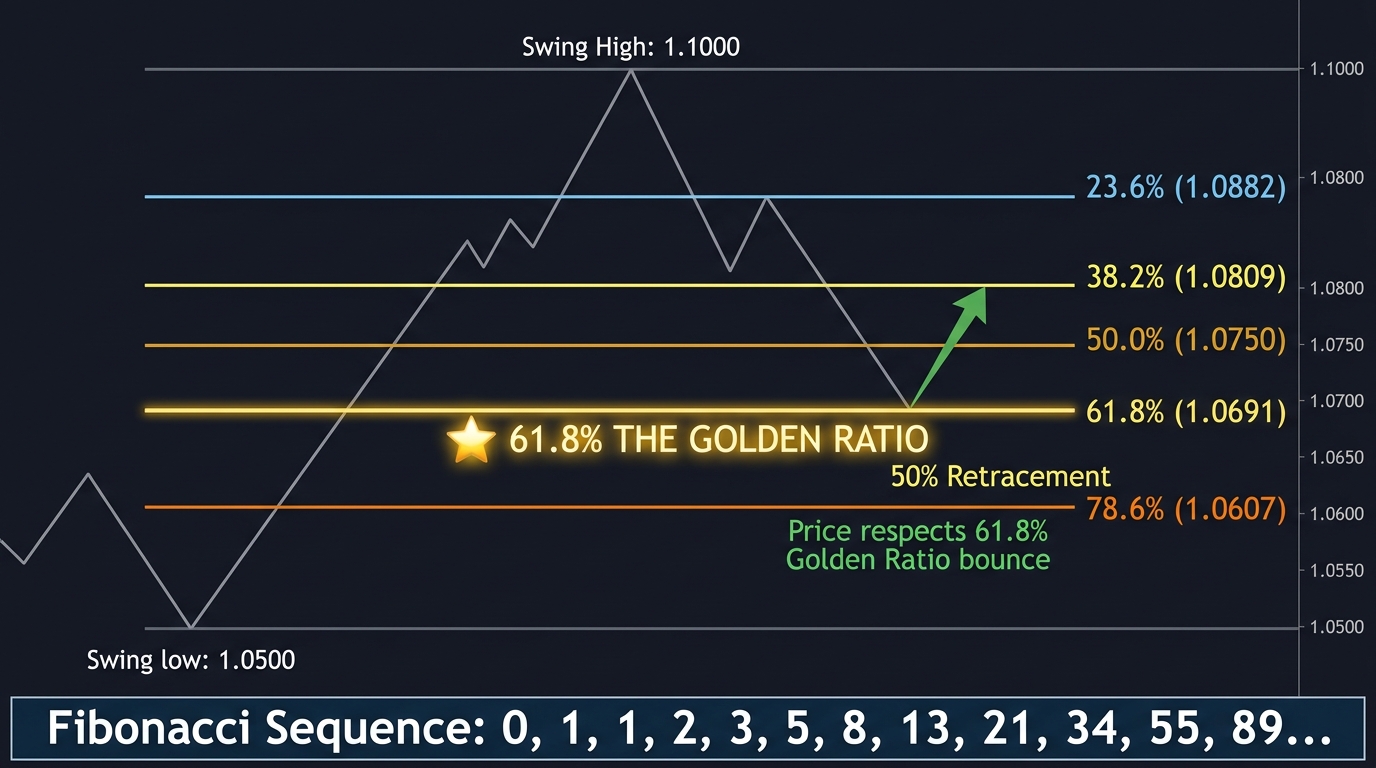
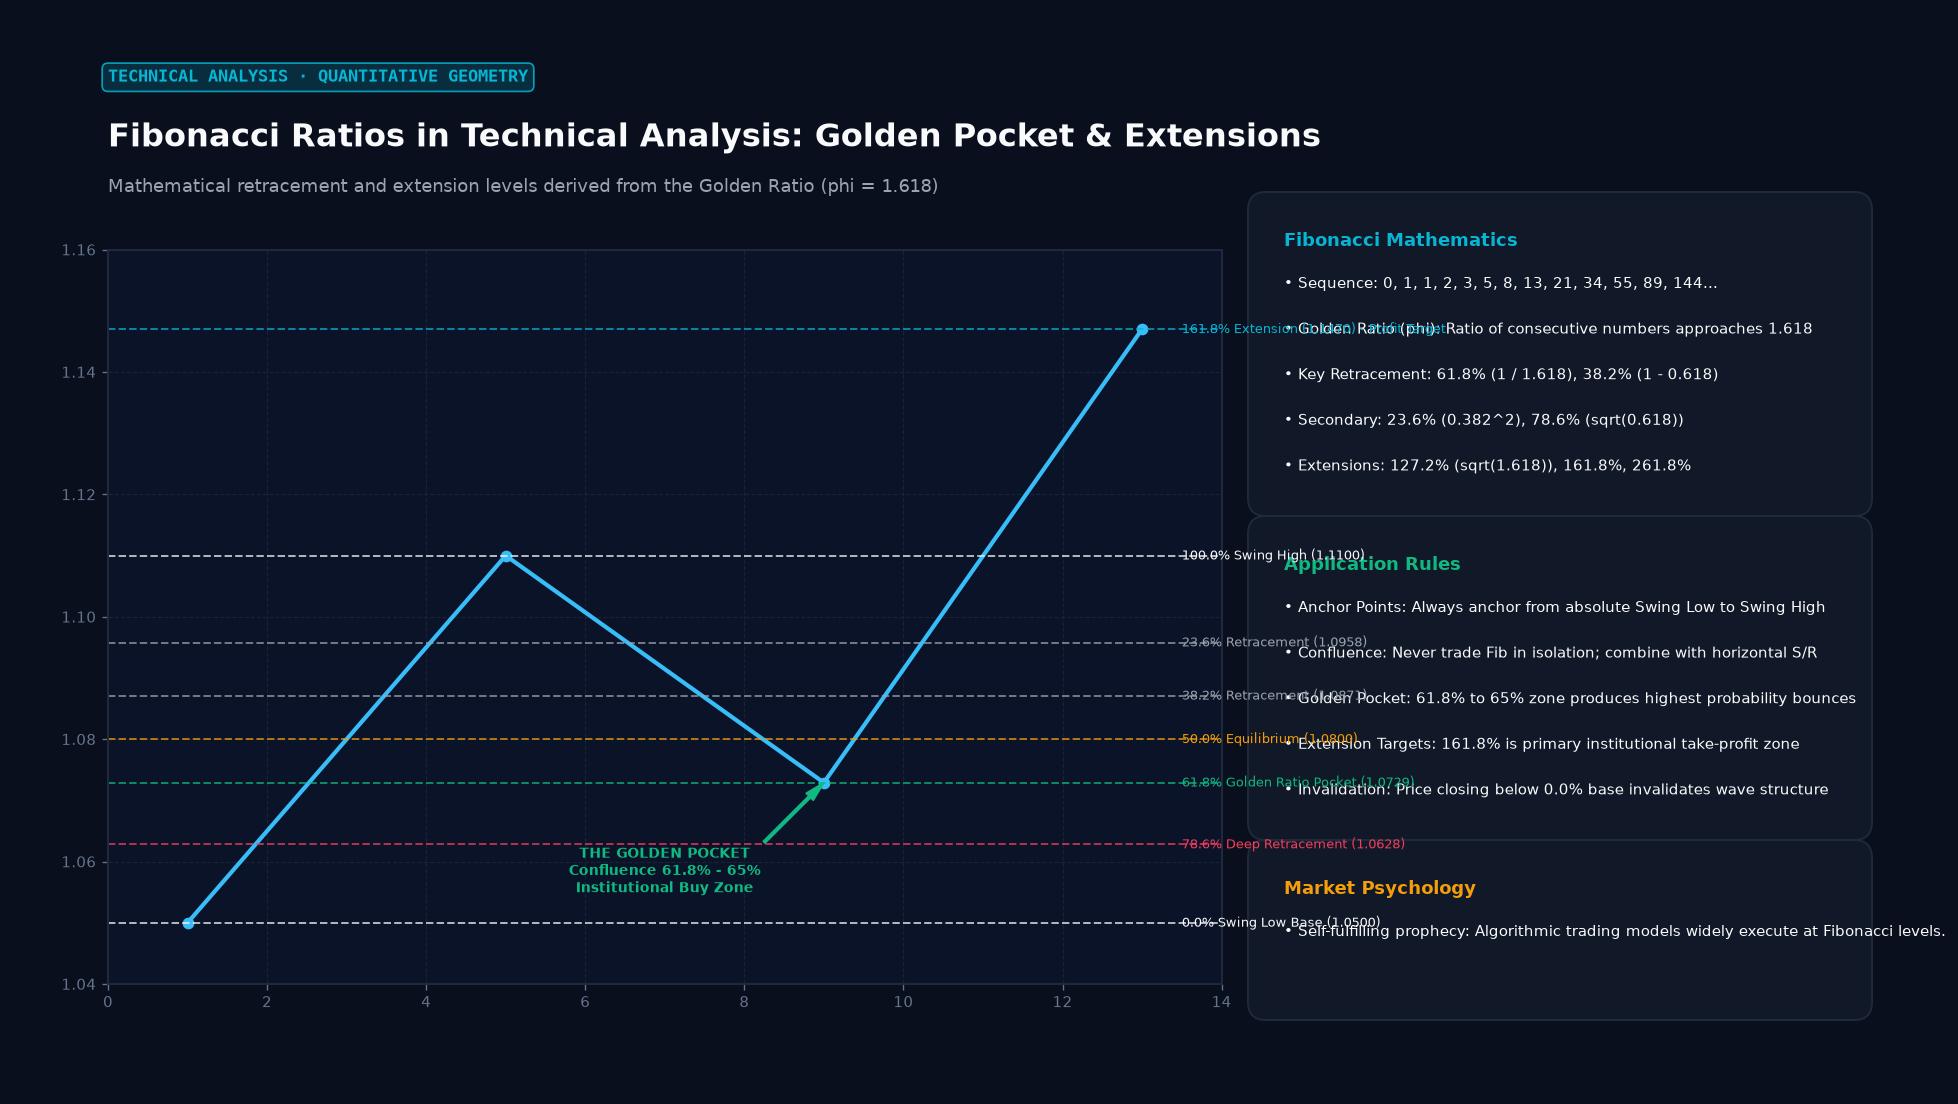 Figure: Mathematical retracement and extension levels derived from the Golden Ratio (phi = 1.618)
The Four Key Fibonacci Levels
61.8% — The Golden Ratio The most significant Fibonacci level in trading. When a currency pair completes a major move and begins retracing, a pullback to the 61.8% level frequently marks the point where the original trend resumes. On a move from 1.0600 to 1.1000 (400 pips), the 61.8% retracement sits at 1.0753. Institutional traders watch this level actively, which creates significant buy/sell orders concentrated there.
38.2% The shallower retracement level. Traders in strong trends often expect pullbacks to hold at 38.2%, signaling robust underlying momentum. A retracement that only reaches 38.2% before resuming trend is frequently more powerful than one that drops to 61.8%.
23.6% Very shallow pullback. Common in the strongest trending conditions when the market barely pauses before continuation. Often combined with momentum indicators to confirm the trend is intact.
50.0% Technically not a Fibonacci number — it’s derived from Dow Theory, not the sequence. However, it’s included on almost every Fibonacci tool because price consistently respects the 50% retracement level. Call it a mathematical coincidence or a self-fulfilling expectation; either way, it works frequently enough to include.
How to Draw Fibonacci Retracements Correctly
The tool is applied by selecting two anchor points: the swing low (beginning of an upswing) and the swing high (end of the swing). The platform automatically places horizontal levels at the Fibonacci ratios between those two points.
The quality of the resulting levels depends entirely on choosing meaningful swing points. Use closing prices, not intraday wicks, as your anchors on daily charts. On intraday charts, the choice between close-to-close or high-to-low depends on the overall volatility of the instrument — wick-to-wick anchoring is more appropriate in volatile conditions where wicks regularly represent genuine rejection, not just noise.
Fibonacci Extensions: Projecting Targets Beyond the Swing
Retracements identify potential pullback support. Fibonacci extensions project where price might travel after the retracement ends — effectively setting price targets for the next leg of the trend.
Common extension levels: 127.2%, 161.8%, 200%, 261.8%. On an EUR/USD bullish move from 1.0600 to 1.1000 that retraces to 61.8% (1.0753), the extension targets for the next leg would be:
- 127.2%: 1.1053
- 161.8%: 1.1247
- 261.8%: 1.1647
These levels function best when they coincide with prior structural highs or resistance zones — confluence between Fibonacci projections and chart structure makes targets significantly more credible.
Fibonacci Confluence: Where the Levels Stack
Fibonacci analysis becomes most reliable when multiple levels from different swing points converge in the same price zone. If the 61.8% retracement from the main swing, the 38.2% retracement from a secondary swing, and a prior significant support level all fall within a 15-pip range, that zone carries substantially more weight than any single Fibonacci level in isolation.
Experienced traders specifically look for these confluence zones before entering retracement trades. The more overlapping levels, the stronger the potential support or resistance.
Fibonacci in Elliott Wave Analysis
Ralph Nelson Elliott’s wave theory explicitly incorporates Fibonacci ratios as the mathematical scaffolding of market structure. Wave 2 typically retraces 61.8% of Wave 1. Wave 3 often extends to 161.8% of Wave 1. Wave 4 retraces 38.2% of Wave 3. The relationship between Elliott Wave counts and Fibonacci levels explains why many technical analysts study both frameworks together.
Key Takeaways
- Key retracement levels: 23.6%, 38.2%, 50.0%, 61.8%, 78.6%
- 61.8% (the Golden Ratio) is the most watched and most reliable single level
- Extensions (127.2%, 161.8%, 261.8%) project targets beyond the prior swing
- Confluence — multiple Fibonacci levels stacking in the same zone — produces the strongest setups
- Draw the tool correctly: use significant swing highs and lows as anchors
FAQ
Why do Fibonacci levels work in financial markets? Two explanations coexist. The mathematical one: Fibonacci ratios appear in natural growth systems and may reflect underlying structural patterns in market crowd behavior. The behavioral one: enough traders watch and act on these levels that they become self-fulfilling concentrations of orders. Both explanations probably contain truth.
What if price breaks through a Fibonacci level? It happens. No level holds 100% of the time. If price breaks through the 61.8% level, the next meaningful support is often at 78.6%. A clean break through 78.6% typically invalidates the retracement thesis entirely — the original swing is more likely a full trend reversal than a corrective pullback.
Ready to trade forex?
Open a free demo account with a regulated broker. Practice with virtual funds before risking real money.