Fill Price
The fill price is the exact, legally binding exchange rate or asset price at which a buy or sell order is executed and fulfilled in the market, establishing the trader's cost basis and determining net transaction performance.
What Is a Fill Price?
In financial market trading, the fill price (or execution price) is the actual, realized price per unit at which an order to buy or sell a currency pair, stock, or derivative contract is completed. When a trader submits an order instruction, the price displayed on the chart or order ticket represents the requested or quoted price. The fill price, however, represents the price at which the order actually matches with an opposing counterparty on the exchange or interbank matching engine.
The fill price establishes the official cost basis of the trade. All subsequent floating and realized profits and losses, margin calculations, and overnight financing swaps are calculated directly from this benchmark. In liquid, quiet market conditions, the fill price is frequently identical to the requested price; during fast markets or when trading large volumes, the fill price often diverges due to slippage and order book depth.
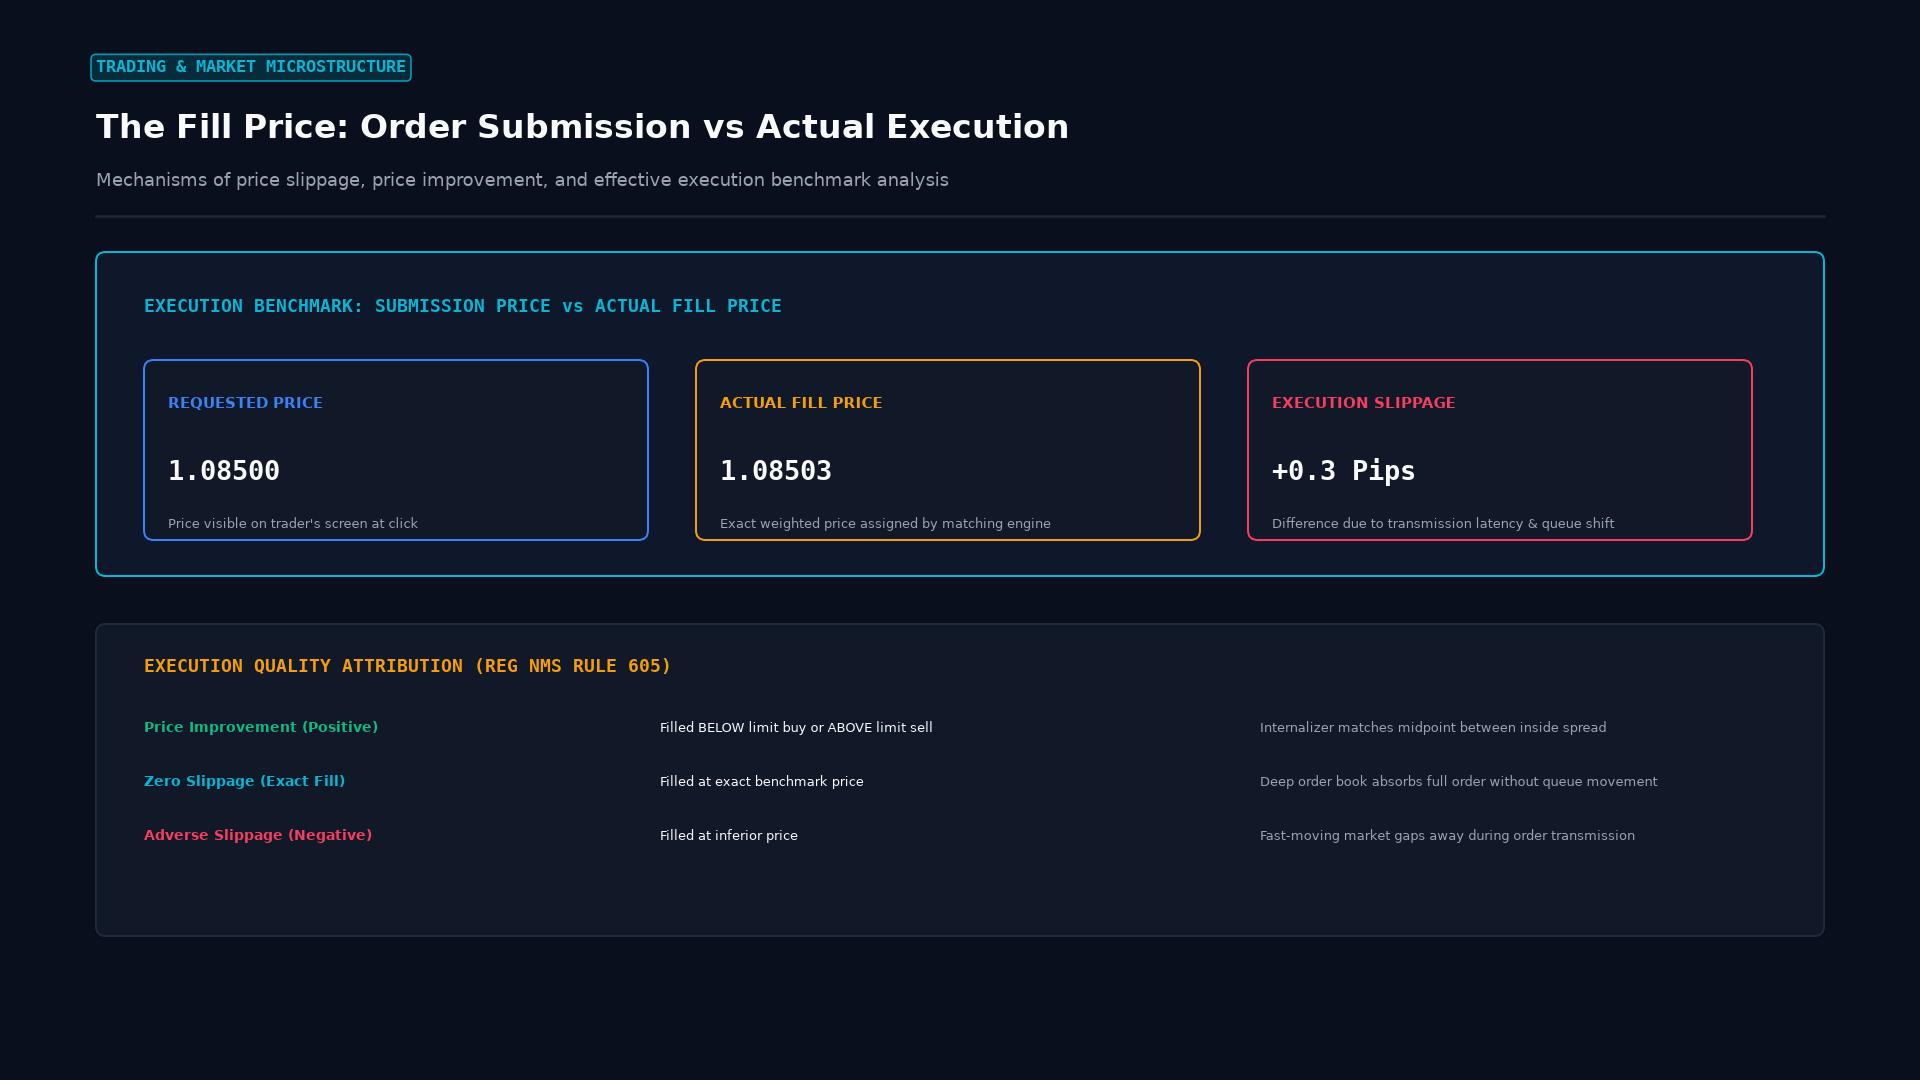 Figure: Execution price benchmark analysis: comparing submitted order price against executed fill price, quantifying positive price improvement versus adverse negative slippage.
Key Takeaways
- Cost Basis Anchor: The fill price is the definitive accounting figure printed on the Deal Ticket that locks in the initial financial commitment of the transaction.
- Slippage Impact: When using market orders, the variance between the requested price and the final fill price is known as slippage: $\text{Slippage} = \text{Fill Price} - \text{Requested Price}$.
- Limit Order Guarantee: A Limit Order guarantees that the fill price will be equal to or better than the specified price; it eliminates negative slippage entirely.
- Volume-Weighted Average Price (VWAP): Large institutional block orders that consume multiple tiers of the order book receive a blended, volume-weighted average fill price.
The Math Behind Fill Prices and Slippage
When executing market orders, price movement between the moment the trader clicks and the moment the order reaches the server creates positive or negative slippage:
Example: Buying EUR/USD with Negative Slippage
- Trader clicks “Buy”: Screen Ask shows $1.08000$.
- Fill Confirmation: Market moves during a data release; order fills at $1.08015$.
- Slippage Calculation: $$\text{Slippage} = 1.08015 - 1.08000 = +0.00015 \text{ (+1.5 Pips)}$$ The trader enters the long position at a 1.5-pip disadvantage, requiring the market to travel 1.5 pips higher just to reach break-even.
Example: Selling USD/JPY with Positive Slippage
- Trader clicks “Sell”: Screen Bid shows $150.000$.
- Fill Confirmation: Fills at $150.020$ on an honest A-Book ECN bridge.
- Slippage Calculation: $$\text{Slippage} = 150.020 - 150.000 = +0.020 \text{ (+2.0 Pips)}$$ The trader sells 2 pips higher than requested, gaining an immediate positive financial advantage.
Multi-Tier Order Book Sweeps: Calculating the VWAP Fill Price
When institutional orders exceed top-of-book market depth, the trade sweeps through multiple liquidity tiers. The resulting fill price is the Volume-Weighted Average Price (VWAP):
$$\text{VWAP Fill Price} = \frac{\sum (\text{Price}_i \times \text{Volume}_i)}{\text{Total Order Volume}}$$
Assume an institutional desk submits a market buy order for 10 standard lots (1,000,000 units) of GBP/USD into the following interbank book:
| Tier | Available Depth | Liquidity Provider Price | Tranche Cost |
|---|---|---|---|
| Tier 1 | 4 Lots (400,000) | 1.27000 | $$508,000$ |
| Tier 2 | 4 Lots (400,000) | 1.27010 | $$508,040$ |
| Tier 3 | 2 Lots (200,000) | 1.27030 | $$254,060$ |
| Total | 10 Lots | — | $1,270,100 |
$$\text{Final VWAP Fill Price} = \frac{$1,270,100}{1,000,000} = 1.27010$$
Even though the trader saw a top-of-book price of 1.27000, their actual fill price is 1.27010 due to the size of the order sweeping available depth.
Evaluating Execution via Transaction Cost Analysis (TCA)
Institutional fund managers employ Transaction Cost Analysis (TCA) software to grade broker fill prices:
- Implementation Shortfall: Measures the total drag on returns caused by the difference between the decision price (when the portfolio manager decided to trade) and the final fill price.
- Spread Capture Ratio: Analyzes whether the broker consistently fills orders closer to the bid, the ask, or the midpoint of the spread.
- Asymmetric Slippage Audit: Confirms that the broker passes positive slippage to the client as frequently and in equal magnitude as negative slippage.
Frequently Asked Questions
Can a fill price be better than my requested limit price?
Yes. If you place a Buy Limit order at 1.0800, and the market suddenly gaps down to 1.0790, an honest STP/ECN broker will pass the price improvement to you, filling your order at the superior price of 1.0790 (positive slippage).
Why is my fill price different from the price shown on the candlestick chart?
Candlestick charts on most trading platforms are drawn using Bid prices by default. When you execute a Buy order, you are filled at the Ask price (Bid + Spread). Therefore, your fill price will appear slightly above the candle high or body on the chart.
What should I do if a broker repeatedly gives me poor fill prices?
If your broker consistently delivers heavy negative slippage during calm market conditions while never passing positive slippage, your order flow may be subjected to artificial dealer delays (virtual dealer plugins). You should switch to a regulated broker that offers ECN/STP execution with transparent Level 2 depth.
Ready to trade forex?
Open a free demo account with a regulated broker. Practice with virtual funds before risking real money.