Flag and Pennant
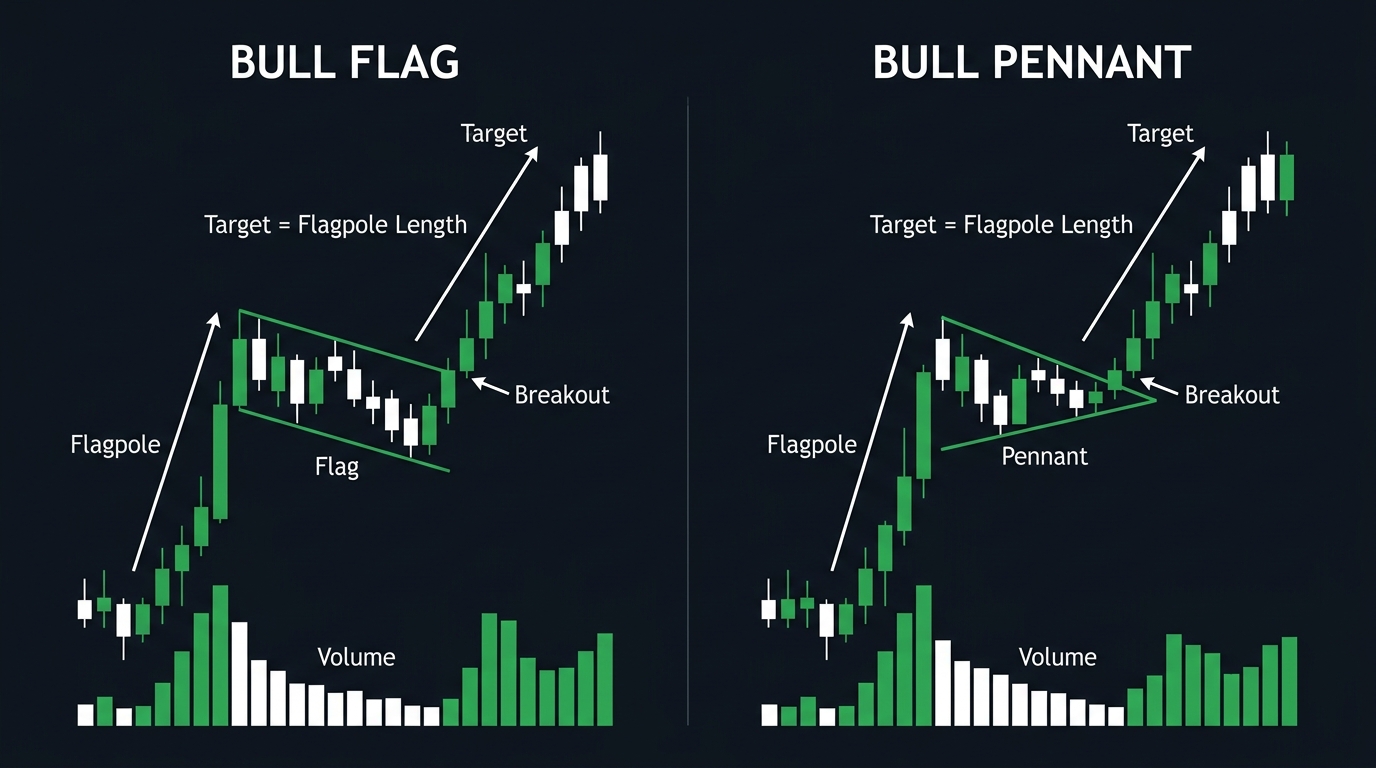
Flags and pennants are short-term continuation chart patterns that form after a sharp, near-vertical price move (the 'flagpole'). They represent a brief consolidation before the trend resumes in the same direction. The flag is a rectangular consolidation sloping slightly against the prior trend; the pennant is a small symmetrical triangle. Both are among the most reliable and cleanest continuation patterns in technical analysis.
Why Flags and Pennants Work
After a fast, impulsive move — price rallying 100 pips in two hours on a strong data release, for example — the market doesn’t typically just continue in a straight line. Traders who participated in the move take profits. New participants who missed the initial move wait for a better entry. The market consolidates, digesting the initial move.
This consolidation period is a flag or pennant. The key insight: if the underlying reason for the initial move (fundamentals, breakout from a major level) is still valid, the consolidation is simply the market reloading for the next leg. When it ends, price resumes the trend with the flagpole length added to the breakout as the measured move target.
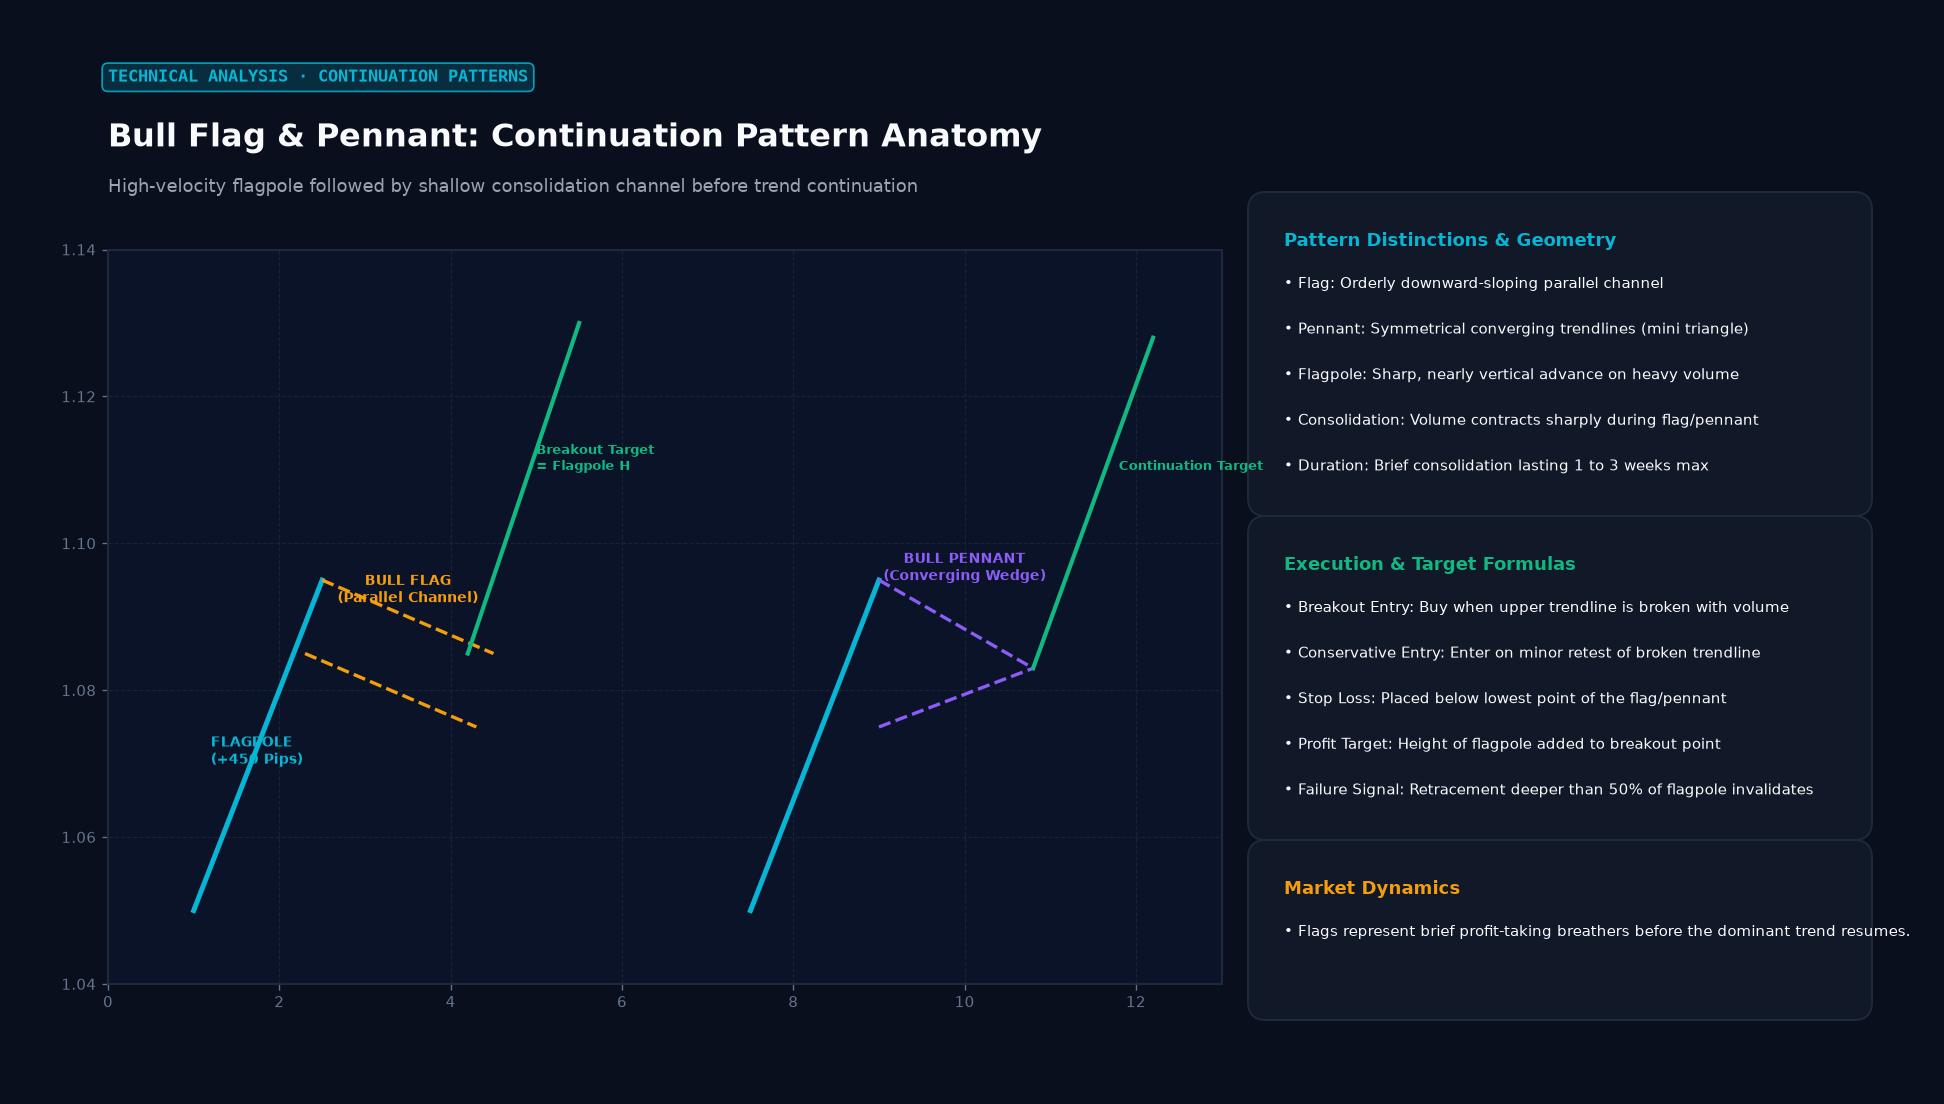 Figure: High-velocity flagpole followed by shallow consolidation channel before trend continuation
The Flag Pattern
Structure: After the sharp directional move (flagpole), price enters a narrow, parallel-channel consolidation that slopes slightly against the trend. In an uptrend (bullish flag), the channel slopes modestly downward. In a downtrend (bearish flag), it slopes modestly upward.
The flag channel should be relatively tight and orderly. Wide, volatile consolidations are less reliable. The slope should be gentle — if the corrective channel drops more than 50-60% of the flagpole height, it becomes less reliable as a continuation pattern and may instead be a full reversal.
Duration: Flags typically form over 5-20 bars on the trading timeframe. Longer consolidations (50+ bars) lose the “flag” character and become more complex patterns.
Volume: Classic flag analysis (originally developed for stock markets with real volume data) expects declining volume during the flag formation and expanding volume on the breakout. In forex, tick volume can serve as a proxy — declining tick activity during consolidation and a volume spike on the breakout confirms pattern quality.
Breakout and target: Price breaks through the flag channel boundary in the direction of the original trend. The measured move target is the flagpole length added to the breakout point.
The Pennant Pattern
Structure: After the flagpole, price consolidates in a symmetrical triangle — converging trend lines create a narrowing formation resembling a pennant (like a small triangular flag). The consolidation shows lower highs and higher lows converging toward a point (apex).
The pennant typically takes 10-15 bars to form. Unlike the flag which may slope against the trend, pennants are roughly horizontal or symmetrical.
Breakout: Price breaks out in the direction of the prior trend before reaching the apex (ideally in the first two-thirds of the pattern — later breakouts are less reliable). The measured move target is the same as the flag: flagpole length applied to the breakout level.
Practical Example: EUR/USD Bullish Flag
- Price rallies from 1.0800 to 1.0900 in 3 hours following a strong US CPI miss (flagpole = 100 pips)
- Price then consolidates in a narrow, slightly downward-sloping channel from 1.0900 to 1.0870 over 8 hours (the flag)
- Price breaks above the upper channel boundary at 1.0890
- Measured move target: 1.0890 + 100 pips (flagpole) = 1.0990
The stop-loss is placed below the lower boundary of the flag channel, typically 5-10 pips buffer.
Common Mistakes
Treating every consolidation as a flag: The flagpole must be sharp and near-vertical. A gradual rally followed by a slight pullback is not a flag — it’s just a trend with a normal pullback.
Entering inside the pattern: Entry should be on the breakout from the flag/pennant, not during the consolidation. Price may bounce around inside the pattern for many bars before breaking out.
Missing the slope direction: A bullish flag that slopes upward (not against the trend) is actually less reliable — it suggests the correction is too shallow to absorb enough selling before the next move.
Key Takeaways
- Flags (rectangular, slightly counter-trend sloping) and pennants (symmetrical triangle) are continuation patterns forming after a sharp directional move
- Both require a clear “flagpole” — the initial sharp move that the pattern consolidates
- Measured move target: flagpole length added to the breakout level
- Entry on the break of the pattern boundary, stop below the pattern’s opposing boundary
- Volume should decline during formation and increase on the breakout
FAQ
How do I know if a consolidation is a flag or just noise? A valid flag has: a clearly definable flagpole (sharp move), parallel or converging boundaries, and orderly price action within the consolidation (not erratic whipsawing). If the consolidation overlaps significantly with the flagpole or retraces more than 50-60% of it, it’s likely not a flag.
Do flags work on all timeframes? Yes — they appear on 5-minute charts and daily charts alike. The most reliable flags tend to appear on higher timeframes (4H and daily) because the flagpole represents a larger, more meaningful move, and the breakout carries more volume and conviction.
Ready to trade forex?
Open a free demo account with a regulated broker. Practice with virtual funds before risking real money.