Trend Lines
A trend line is a straight line drawn on a price chart connecting a series of swing highs or swing lows, representing the direction and angle of a trend. In an uptrend, a trend line connects rising swing lows and acts as dynamic support. In a downtrend, it connects falling swing highs and acts as dynamic resistance. Trend lines are one of the oldest and most widely used tools in technical analysis.
Drawing Valid Trend Lines
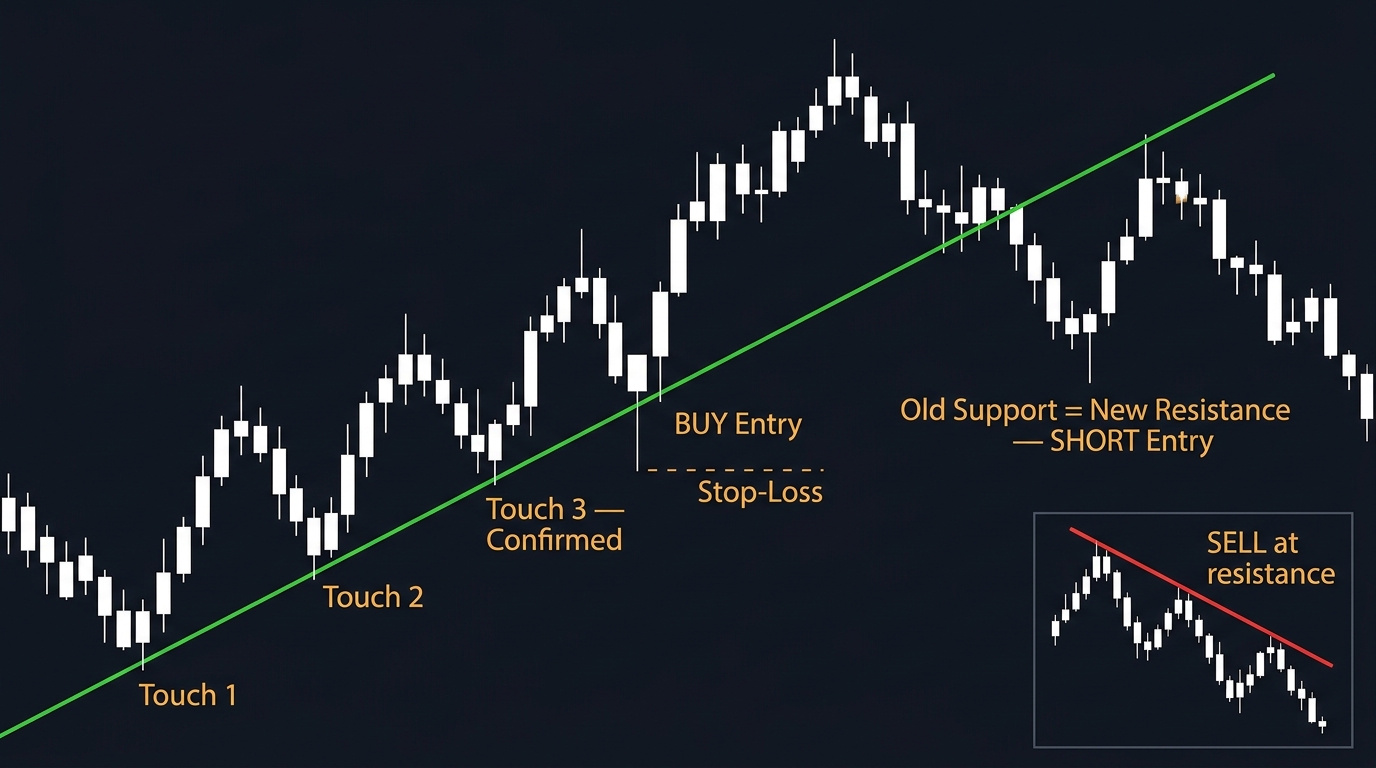
The simplest tools are often misused the most. Trend lines look straightforward — connect two points with a line. But the quality of a trend line depends entirely on which points you connect and how you interpret what the line shows.
Minimum requirement: Two confirmed swing points to draw the line. Three or more touches without a breach confirm the line’s validity.
Uptrend line: Drawn along the rising swing lows (the bottom of pullbacks). Connect at least two consecutive higher lows. The line slopes upward from left to right. As price continues trending, this line provides the first reference point for where buying pressure historically emerged.
Downtrend line: Drawn along the falling swing highs (the peaks of rallies). Connect at least two consecutive lower highs. The line slopes downward. This represents the ceiling that sellers consistently enforce.
Choosing anchor points: Use closing prices on daily charts for cleaner trend lines — wicks can be misleading because they represent intraday extremes rather than where the majority of the session’s trading occurred. On intraday charts (4H and below), wick-to-wick anchoring is sometimes more appropriate because intraday extremes represent actual transacted prices, not just noise.
The Significance of Trend Lines
A trend line’s reliability grows with each successful touch-and-hold. A line tested once has minimal track record. Tested three times and held on all three: now there’s strong evidence that market participants are using this level as a trading reference.
The duration of the trend line also matters. A trend line connecting lows over 9 months carries more structural weight than one connecting lows over 9 days. Longer-running trend lines represent longer-term consensus about the trend’s baseline — they have more participant memory built around them.
Angle matters too. Very steep trend lines (45°+) are rarely sustained for long. They represent parabolic moves that eventually exhaust themselves and correct sharply. Moderately angled trend lines (20-35°) are more sustainable and tend to hold longer. When a steep trend line breaks, the correction is often larger and faster than the break of a moderate one.
Trading Trend Line Bounces
The classic trend line trade:
- Identify a valid uptrend line with 2-3 confirmed touches
- Wait for price to pull back to the trend line again
- Look for a confirming bullish candlestick at the line (hammer, bullish engulfing, pin bar)
- Enter long on the close of the confirming candle, stop below the trend line
- Target the previous high or a measured move projection
The stop placement is critical. Placing the stop directly at the trend line often results in being stopped out by normal wick penetration before the bounce occurs. A buffer of 5-15 pips below the trend line on daily charts accounts for this noise.
Trend Line Breaks: Entry Signals
When a trend line breaks — price closes convincingly on the other side — it signals a potential trend change. This is not automatically a reversal signal, but it is a warning that the trend structure has been violated.
Three scenarios after a break:
- Immediate continuation in breakout direction: Enter in the direction of the break, targeting next support/resistance
- Retest of the broken trend line: Price breaks, then pulls back to test the line from the other side. This offers a lower-risk entry — you see whether the former support/resistance is holding as new resistance/support before committing
- False break: Price breaks the trend line and immediately reverses, closing back on the original side. This is a “fakeout” and often produces the opposite of the expected move with significant momentum
Trend Lines vs. Channels
When price respects both a support trend line and a parallel resistance trend line simultaneously, the formation is called a channel. Channels can be ascending (both lines sloping upward), descending (both sloping downward), or horizontal (a range).
Channels provide natural profit targets: if you buy at the support trend line, the parallel resistance line provides the first target. The channel width equals the expected move from any given entry at the boundary.
Common Trend Line Mistakes
Forcing a line through too many points: If a trend line requires “adjusting” the anchor points to make it fit, it’s not a genuine trend line.
Using arbitrary points: A trend line should connect meaningful swing points, not just any two touches of a ruler.
Over-precision: No trend line holds exactly. Markets approach support and resistance zones, not single price points. Treat trend lines as approximate levels with a buffer zone, not precise lines.
Key Takeaways
- Trend lines connect swing lows (uptrend) or swing highs (downtrend) — minimum two points, three confirms validity
- Third touch without breach significantly increases reliability
- Steeper trend lines are less sustainable; moderate angles (20-35°) hold longer
- Trade bounces at the trend line with candlestick confirmation; stop below the line with a buffer
- Trend line breaks signal potential trend change — wait for retest or act on the close through the line
FAQ
Should trend lines be drawn on closing prices or wicks? On daily charts, closing prices provide cleaner, more reliable trend lines — they represent where the market chose to end the session, which carries more informational weight than intraday extremes. On shorter timeframes, the choice is more subjective. Many traders use both: start with closing price anchors, then adjust if the wick-based line has more confirmed touches.
How many trend lines should I have on my chart? As few as necessary. A chart crowded with trend lines becomes difficult to interpret. Focus on the 1-2 trend lines most relevant to the current price action and the timeframe you’re trading. The cleaner the chart, the clearer the decisions.
Ready to trade forex?
Open a free demo account with a regulated broker. Practice with virtual funds before risking real money.