Channel
A channel is a price pattern formed by two parallel trend lines that contain price movement — an upper line connecting swing highs and a lower line connecting swing lows. Channels can slope upward (ascending channel, bullish), downward (descending channel, bearish), or move horizontally (ranging channel). They provide clear, structural boundaries for both support and resistance trading and are among the most visually intuitive patterns in technical analysis.
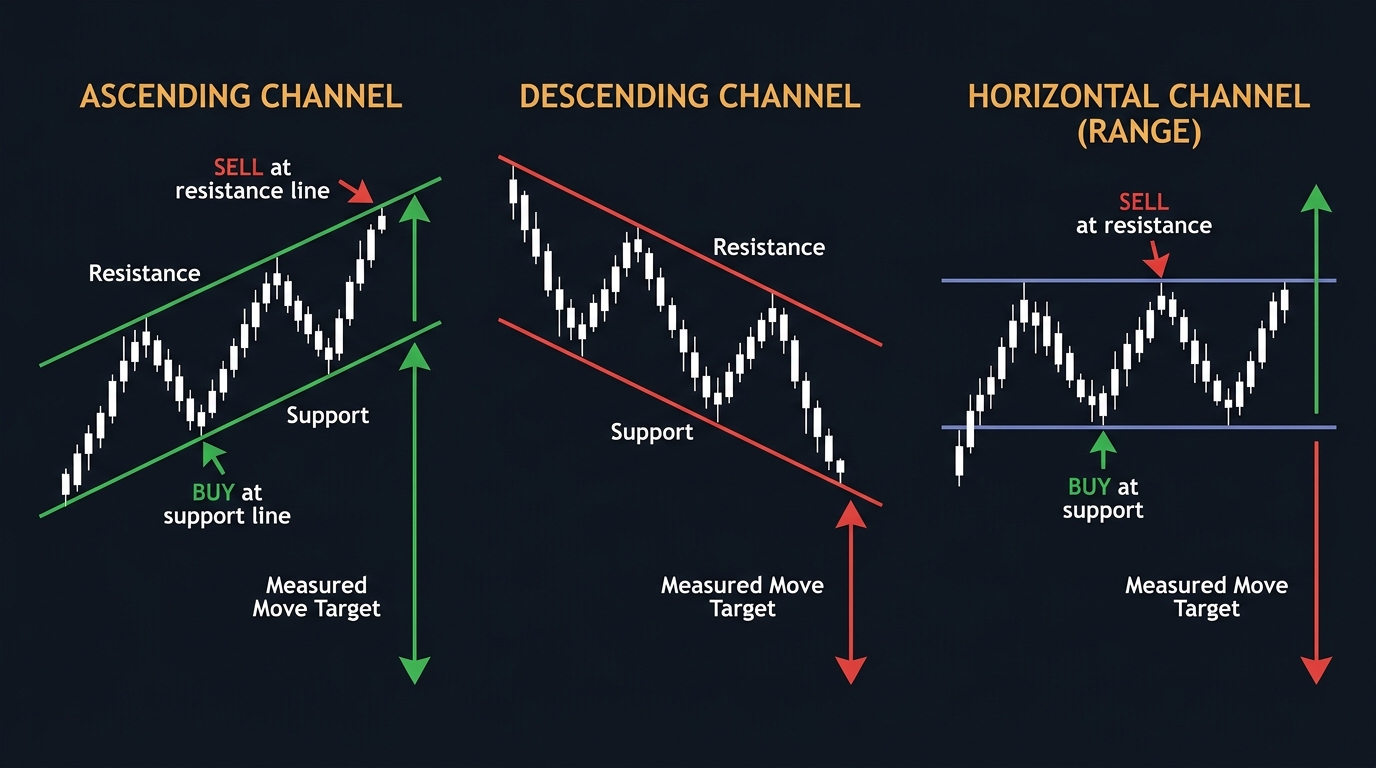
Understanding Price Channels
Markets don’t move in straight lines — they oscillate. Even in strong trends, price alternates between impulse moves (in the trend direction) and corrective pullbacks (against the trend). A channel formalizes this oscillation by identifying the consistent boundaries within which price has been oscillating.
Two correctly drawn parallel lines enclosing most of the recent price action define a channel. Once established, the pattern provides two distinct trading opportunities: buying the lower channel boundary (support) and selling the upper boundary (resistance).
The Three Types of Channels
Ascending channel (bullish): Both the support line and resistance line slope upward. A series of higher lows connects along the lower trend line; a series of higher highs connects along the upper line. Price is trending upward but in a structured, oscillating manner.
In an ascending channel, the preferred trade is buying the lower channel boundary (the trend-following direction). Selling the upper boundary is possible but counter-trend — lower probability and requires more precise timing and confirmation.
Descending channel (bearish): Both lines slope downward. Lower highs on the upper line, lower lows on the lower line. The primary trade is selling the upper boundary with the trend. Buying the lower boundary is counter-trend.
Horizontal channel (range): Both lines are approximately flat. The pair is in a well-defined range with clear ceiling and floor. Both buying support and selling resistance carry similar probability — the direction of the broader trend (on a higher timeframe) determines which side has the edge.
Drawing a Valid Channel
The same principles that apply to trend lines apply to channels:
- Minimum two touches on each line to establish validity
- The lines must be parallel — not converging (triangle) or diverging (wedge)
- Both lines must have clear, meaningful swing point anchors — not arbitrary touches
The support and resistance lines should be parallel. If they’re not, you may be looking at a wedge (converging lines, which is a different pattern with different implications) or a broadening pattern (diverging lines).
Trading the Channel Boundaries
Buying the support line (lower boundary):
- Price pulls back to the lower channel line
- A confirming bullish candlestick forms at the boundary (hammer, bullish engulfing, pin bar)
- Enter long with stop just below the channel line (5-15 pip buffer)
- Target: upper channel boundary (natural profit target)
Selling the resistance line (upper boundary):
- Price rallies to the upper channel line
- A confirming bearish candlestick forms (shooting star, bearish engulfing)
- Enter short with stop just above the channel line
- Target: lower channel boundary
The risk-reward on channel trades is naturally clean: the target (the opposite boundary) is clearly defined, and the stop (just outside the current boundary) is logical.
Channel Breakouts
Channels don’t last forever. When price breaks convincingly through one of the channel boundaries — especially with expanding volume or a strong impulsive candle — it signals that the channel structure has broken down.
Breakout from an ascending channel upward: Accelerating bullish momentum — the trend is intensifying. New, steeper channel may form.
Breakout below an ascending channel: Trend reversal warning. The series of higher lows has been violated. The first target is the last major swing low before the channel formed.
Breakout below a horizontal channel: The range has resolved into a new downtrend. Measured move target: the channel height subtracted from the breakout level.
The measured move for any channel breakout: the channel height (distance from upper to lower line) applied to the breakout point in the direction of the break.
Channels and Bollinger Bands: Conceptual Siblings
Bollinger Bands and price channels are conceptually similar — both create dynamic boundaries around price. The key difference: Bollinger Bands adapt automatically to volatility (expanding/contracting based on standard deviation), while manual channels are drawn by the trader based on actual swing points.
In practice, some traders use Bollinger Bands as a quick channel proxy on volatile instruments, while preferring manually drawn channels on instruments with cleaner, more identifiable swing structure.
Key Takeaways
- Channels are two parallel trend lines enclosing price oscillation within a trend or range
- Three types: ascending (bullish), descending (bearish), horizontal (ranging)
- Buy the support line and sell the resistance line — with the trend for highest probability
- Valid channel requires at least two confirmed touches on each boundary
- Channel breakouts provide directional signals with measured move targets equal to channel height
FAQ
What’s the difference between a channel and a range? The terms are often used interchangeably, but technically: a “range” usually refers to a horizontal channel where the boundaries are flat. An “ascending channel” or “descending channel” implies a trending structure where both boundaries slope in the same direction. The trading approach differs — trending channels favor the trend direction at the support line; horizontal ranges treat both sides more symmetrically.
How do I know when to stop trading a channel and expect a breakout? Watch for: declining momentum on successive tests of the boundary (RSI divergence, decreasing range of candles at the level), very narrow approaches to the boundary without significant reversal, and broader fundamental context changing. No formula predicts breakouts perfectly — position sizing conservatively when approaching a boundary after multiple tests, since tested levels eventually fail.
Ready to trade forex?
Open a free demo account with a regulated broker. Practice with virtual funds before risking real money.