Industrial Production
Industrial production is a key monthly macroeconomic indicator published by the Federal Reserve Board that measures the real physical output of a nation's manufacturing plants, mining facilities, and electric and gas utilities.
What Is Industrial Production?
The Industrial Production Index (IPI) is a major monthly macroeconomic indicator released by the Board of Governors of the Federal Reserve System. It measures the real, physical volume of goods produced by domestic manufacturing facilities, mining operations, and electric and gas utilities in the United States. Unlike dollar-denominated reports like Factory Orders or Retail Sales, industrial production is measured in physical units (e.g., tons of steel, barrels of crude oil, kilowatt-hours of electricity, and number of assembled automobiles), stripping out the distorting effects of price inflation.
Along with the headline industrial production figure, the Federal Reserve simultaneously publishes the Capacity Utilization Rate—a critical metric measuring how much of the nation’s total industrial productive capacity is actively being utilized. Together, these two data points provide foreign exchange and fixed-income traders with an unvarnished assessment of economic momentum, capital investment, and emerging inflationary pressures.
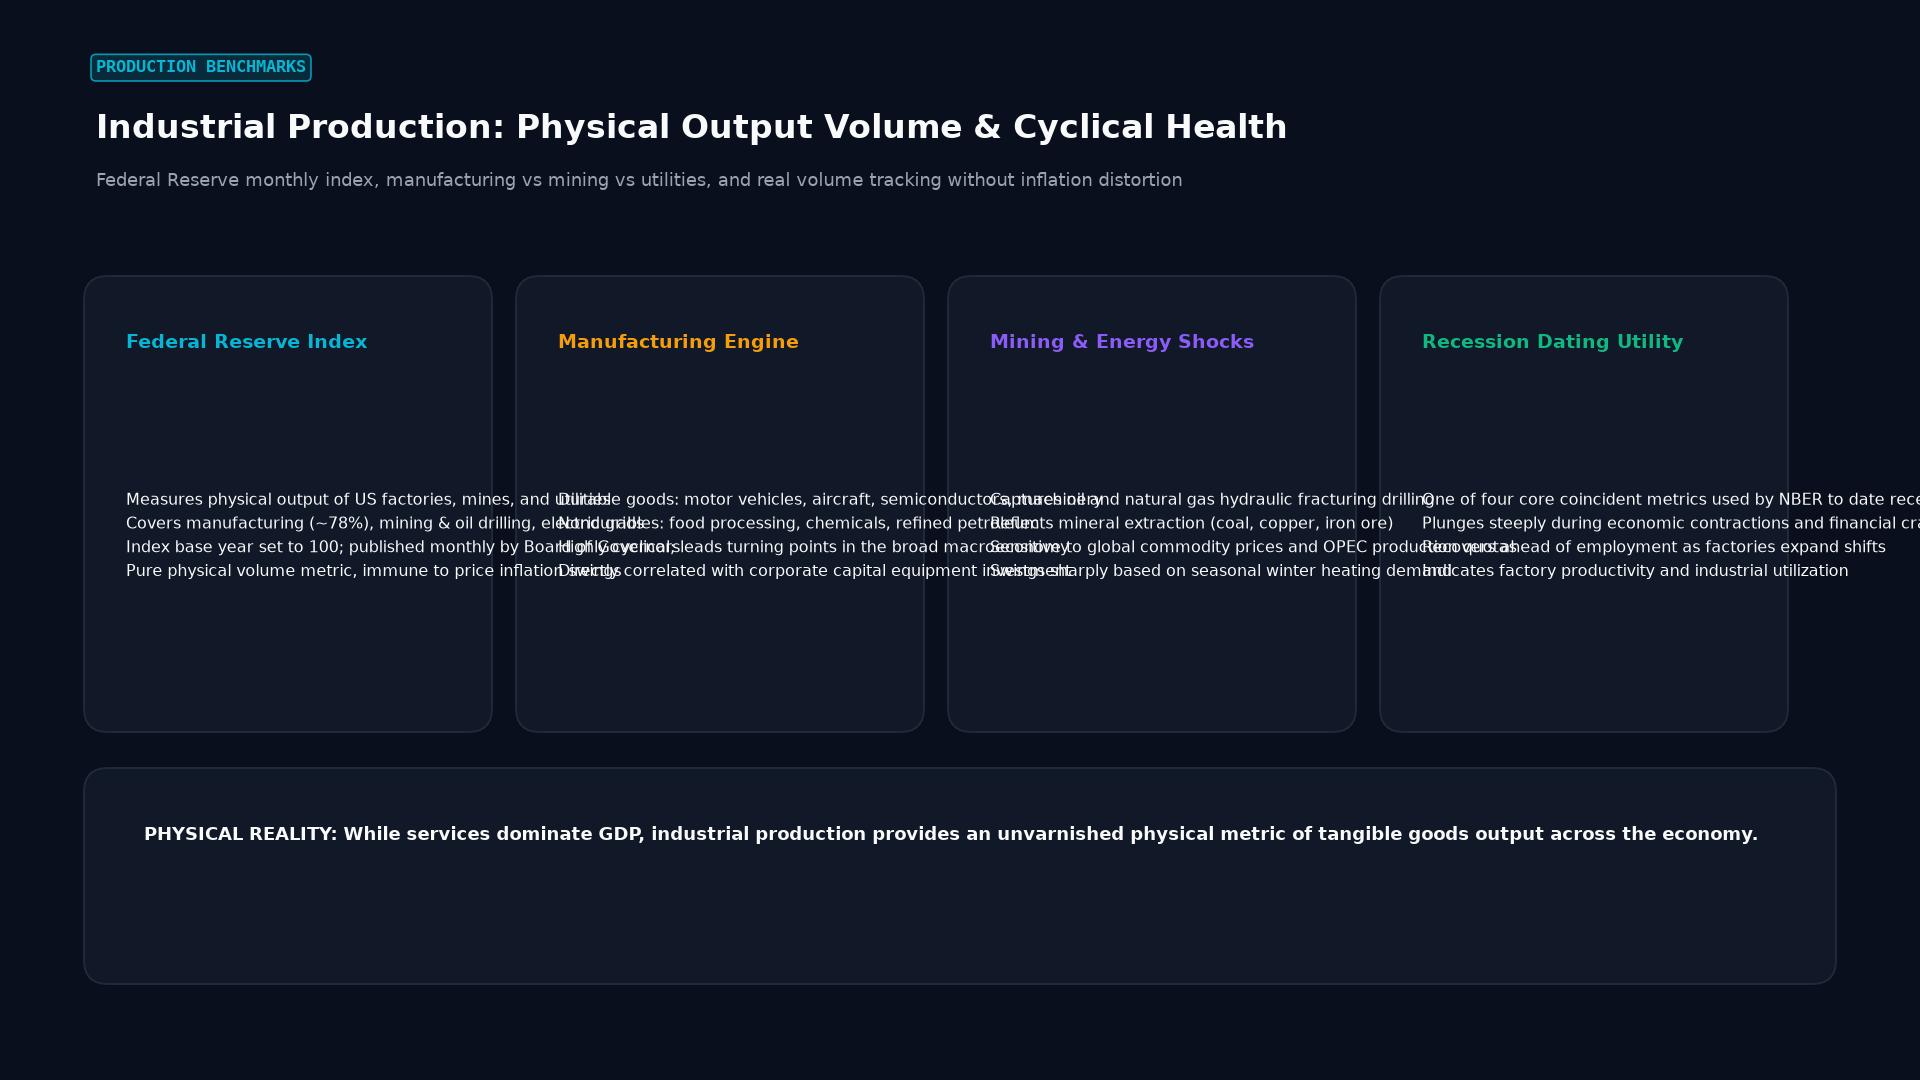 Figure: Federal Reserve monthly index, manufacturing vs mining vs utilities, and real volume tracking without inflation distortion
Key Takeaways
- Physical Output Metric: Measures pure physical volume, providing an inflation-free gauge of industrial momentum.
- Manufacturing Dominance: Manufacturing comprises roughly 75% of the total index; economists closely monitor the manufacturing sub-index to assess corporate sector health.
- The Capacity Utilization Trigger: When Capacity Utilization rises above 80% to 85%, industrial capacity becomes strained, signaling emerging supply bottlenecks and upward pressure on producer prices.
- Direct Fed Involvement: Because this report is produced directly by the Federal Reserve’s own research staff, FOMC members heavily weight its findings when formulating interest rate policy.
Industrial Production Index (IPI) Components
The Federal Reserve classifies industrial production into three major sectors:
| Sector | Index Weight | Economic Characteristics & Volatility Drivers |
|---|---|---|
| Manufacturing | ~75% | Highly cyclical; mirrors global trade, corporate capital expenditures, and consumer durable demand. |
| Mining | ~14% | Heavily driven by domestic oil and natural gas drilling (shale fracking activity), global energy prices, and mineral extraction. |
| Utilities | ~11% | Weather-dependent; unseasonably hot summers or freezing winters cause sharp spikes in air conditioning and heating energy demand. |
Capacity Utilization: The Inflation Early-Warning System
Released in the exact same statistical release, the Capacity Utilization Rate expresses actual physical output as a percentage of the maximum sustainable output the nation’s factories could produce if running at full capacity:
$$\text{Capacity Utilization} = \left(\frac{\text{Actual Industrial Output}}{\text{Potential Maximum Sustainable Capacity}}\right) \times 100%$$
Capacity Utilization Inflation Thresholds:
┌────────────────────────────────────────────────────────┐
│ CAPACITY UTILIZATION > 85%: EXTREME INFLATION RISK     │
│ Factories running 24/7; machine breakdowns, overtime   │
│ wages surge; supply bottlenecks push producer prices up│
├────────────────────────────────────────────────────────┤
│ CAPACITY UTILIZATION 78%–82%: BALANCED / HEALTHY RANGE │
│ Sustainable economic expansion without price spikes    │
├────────────────────────────────────────────────────────┤
│ CAPACITY UTILIZATION < 75%: RECESSIONARY SLACK         │
│ Idle factory floors, layoffs, disinflationary pressure │
└────────────────────────────────────────────────────────┘
Impact on Foreign Exchange and the U.S. Dollar
Currency desks trade the Industrial Production release around the 15th of each month (at 9:15 AM EST):
- Strong Upside Surprises (Bullish for USD): A surging industrial production print paired with capacity utilization above 80% signals robust economic growth. Bond markets price in a more aggressive, hawkish Federal Reserve stance, lifting U.S. Treasury yields and attracting foreign capital into the U.S. Dollar.
- Downside Contraction (Bearish for USD): Consecutive monthly declines in manufacturing output signal that the economy is entering an industrial contraction. FX traders price in potential dovish monetary easing, putting downward pressure on the dollar against rival currencies like the Euro or British Pound.
Frequently Asked Questions
Why does the Industrial Production report sometimes conflict with the ISM Manufacturing PMI?
The ISM Manufacturing Index is a qualitative survey measuring purchasing managers’ sentiment (optimism vs. pessimism). Industrial Production is hard empirical accounting measuring actual physical units produced. Sentiment can plunge during political disputes or supply-chain scares even while actual factory assembly lines continue producing record output.
How does industrial production feed into GDP?
Industrial production accounts for roughly 15% to 20% of total Gross Domestic Product directly, but its cyclical swings account for a disproportionate share of total GDP volatility. Economists use the monthly IPI numbers to fine-tune their “Nowcast” estimates for quarterly GDP growth.
Does industrial production track the services sector?
No. The Industrial Production Index explicitly excludes the services sector (which comprises roughly 75% to 80% of the modern U.S. economy, including healthcare, banking, retail, hospitality, and software). It focuses purely on physical tangible production.
Ready to trade forex?
Open a free demo account with a regulated broker. Practice with virtual funds before risking real money.