ISM Manufacturing Index
The ISM Manufacturing Index, also known as the Purchasing Managers' Index (PMI), is a monthly economic indicator published by the Institute for Supply Management measuring industrial activity, new orders, and employment across the US manufacturing sector.
What Is the ISM Manufacturing Index?
The ISM Manufacturing Index—formally designated the Manufacturing ISM Report on Business and widely recognized globally as the premier US Purchasing Managers’ Index (PMI)—is one of the most influential monthly macroeconomic data releases in global financial markets. Published on the first business day of each month by the Institute for Supply Management (ISM), the report surveys purchasing and supply executives across more than 300 industrial manufacturing firms spanning 18 distinct industries.
Because supply chain executives have immediate, frontline visibility into inbound customer orders, factory production schedules, inventory buildups, and hiring needs, the ISM report acts as an indispensable leading economic indicator. It provides institutional investors, currency traders, and Federal Reserve policymakers with an early snapshot of national economic health weeks before official government GDP or employment data is released.
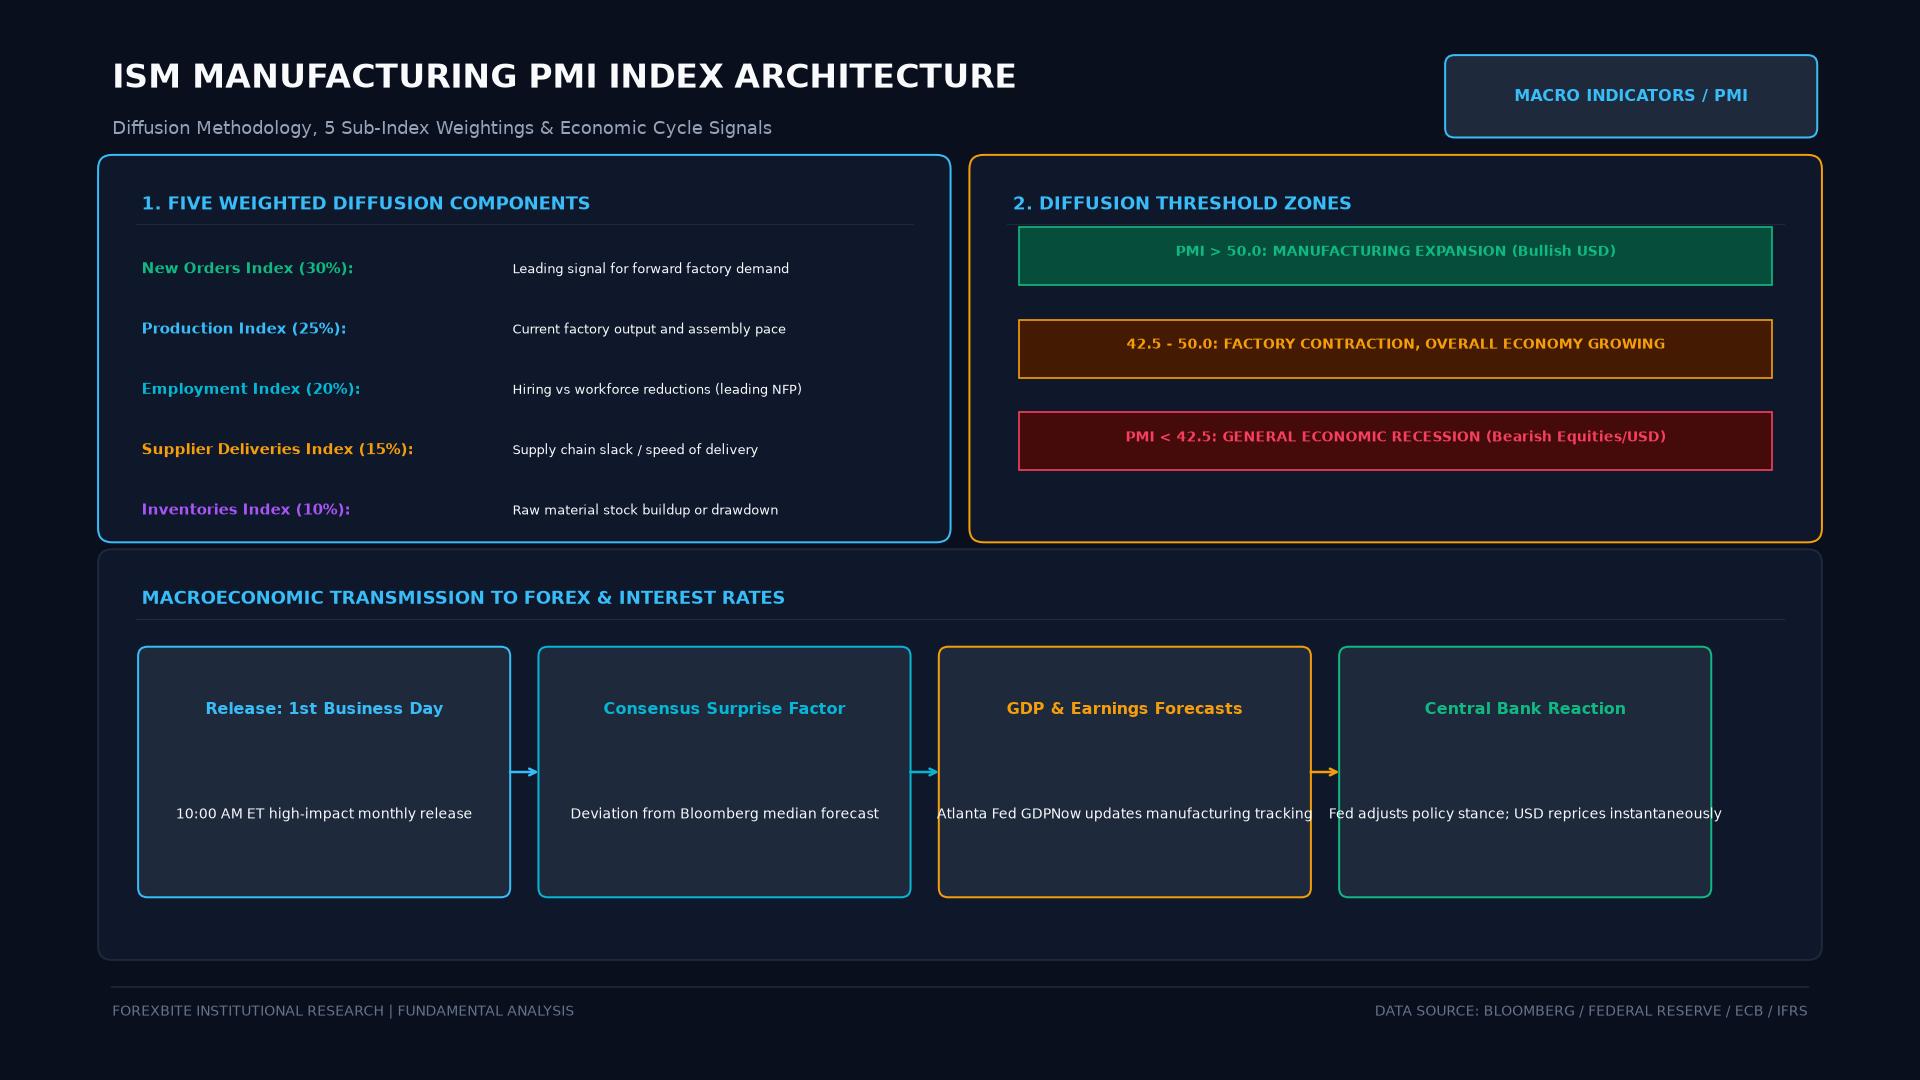 Figure: Institutional anatomy of the ISM Manufacturing PMI, showing the 5 weighted diffusion components (New Orders, Production, Employment, Supplier Deliveries, Inventories), the 50-neutral threshold, and macroeconomic transmission.
The 50.0 Threshold: Interpreting the Headline Index
The headline ISM Manufacturing Index is a composite diffusion index calculated from survey responses that register whether specific business metrics are “higher,” “lower,” or “the same” compared to the prior month.
The figure is benchmarked against the critical threshold of 50.0:
- Reading > 50.0: Indicates that the manufacturing economy is generally expanding.
- Reading < 50.0: Indicates that manufacturing activity is contracting.
- The Recessionary Floor (42.8): Historical regression analysis demonstrates that an ISM reading below 50.0 does not necessarily imply the entire US economy is in a recession, as the services sector constitutes roughly 80% of US GDP. However, a sustained reading below 42.8 over several months indicates that the broader aggregate economy (real GDP) has entered an outright recession.
The Five Core Components of the Composite Index
The headline ISM Manufacturing Index is an equally weighted composite of five primary diffusion sub-indexes:
| Component Sub-Index | Weight | Economic Significance |
|---|---|---|
| New Orders Index | 20% | The ultimate leading metric; reflects future factory output and aggregate demand. |
| Production Index | 20% | Measures real-time current industrial factory output. |
| Employment Index | 20% | Gauges factory hiring and layoffs; acts as an early preview for Friday’s Non-Farm Payrolls (NFP). |
| Supplier Deliveries Index | 20% | Measures delivery speed. Slower deliveries indicate high demand and supply chain friction (index rises). |
| Inventories Index | 20% | Tracks stockpiles of raw materials and finished goods. |
The Prices Paid Index: Inflation’s Canary in the Coal Mine
Alongside the core components, the ISM publishes the ISM Prices Paid Index. This sub-index measures whether manufacturing companies are paying higher or lower prices for raw materials, energy, metals, and chemical inputs. A sharp spike in the Prices Paid sub-index (e.g., jumping above 65.0) signals building pipeline price pressures, alerting bond traders and foreign exchange desks to upcoming surges in the Producer Price Index (PPI) and Consumer Price Index (CPI).
How the ISM Manufacturing Report Impacts Foreign Exchange
Because the ISM report is released at 10:00 AM Eastern Time on the first trading day of the month, it frequently catalyzes intense volatility across US Dollar currency pairs:
Market Reaction Matrix to ISM Manufacturing Release
------------------------------------------------------------------------
Scenario A: ISM Beats Consensus (e.g., Prints 53.5 vs 50.2 expected)
- US Treasury bond yields jump.
- Federal Reserve rate cut probabilities diminish.
- US Dollar appreciates sharply against EUR, GBP, and JPY.

Scenario B: ISM Misses Consensus (e.g., Prints 47.8 vs 51.0 expected)
- US bond yields decline as growth fears take hold.
- Traders price in looser Federal Reserve monetary policy.
- US Dollar depreciates; Gold (XAU/USD) and safe-haven assets rally.
Key Takeaways
- The ISM Manufacturing Index is a monthly diffusion index measuring US industrial manufacturing activity.
- A headline reading above 50.0 signals expansion, while a reading below 50.0 indicates sector contraction.
- The composite index weights five core sub-indexes: New Orders, Production, Employment, Supplier Deliveries, and Inventories.
- The Prices Paid sub-index serves as an essential leading indicator for factory-gate and consumer inflation.
- A stronger-than-expected ISM print typically boosts the US Dollar and sovereign bond yields, while a weak print triggers dollar selloffs.
Frequently Asked Questions
Why does the manufacturing index move markets if manufacturing is only 10% of US GDP?
While services make up the bulk of modern US output, manufacturing is the most cyclical component of the business cycle. Capital goods spending, raw material purchases, and global inventory flows turn up or down long before services, making manufacturing the premier leading indicator for macroeconomic turning points.
What is the difference between ISM Manufacturing and S&P Global (Markit) US Manufacturing PMI?
Both surveys measure US manufacturing sentiment. The ISM survey focuses primarily on large multinational corporations and has a continuous data history dating back to 1931. The S&P Global PMI surveys a broader mix of small-to-medium-sized industrial firms alongside large corporations.
How does the Supplier Deliveries component differ in interpretation?
Unlike other sub-indexes where higher output reflects growth, the Supplier Deliveries index is inverted: a higher number means supplier deliveries are slower. Slower deliveries indicate that suppliers are swamped with orders and experiencing backlogs, which historically correlates with economic expansion.
Ready to trade forex?
Open a free demo account with a regulated broker. Practice with virtual funds before risking real money.