Labor Productivity
Labor productivity is an essential macroeconomic indicator that measures the volume of real economic output (Gross Domestic Product) produced per unit of labor input, typically measured as output per hour worked or output per employed worker.
What Is Labor Productivity?
Labor productivity is a critical macroeconomic metric published by government statistical agencies—such as the U.S. Bureau of Labor Statistics (BLS) and Eurostat—that quantifies the efficiency with which a national workforce transforms labor hours into finished goods and services. It is fundamentally calculated as the ratio of real Gross Domestic Product (GDP) to total hours worked across the economy.
In foreign exchange and global fixed-income markets, labor productivity is closely analyzed by central banks and macro traders because it represents the primary structural driver of long-term sustainable economic growth and living standards. Crucially, rising labor productivity allows wages to expand without triggering spiraling demand-pull or cost-push inflation, granting central banks greater leeway to maintain accommodative policy without risking currency debasement.
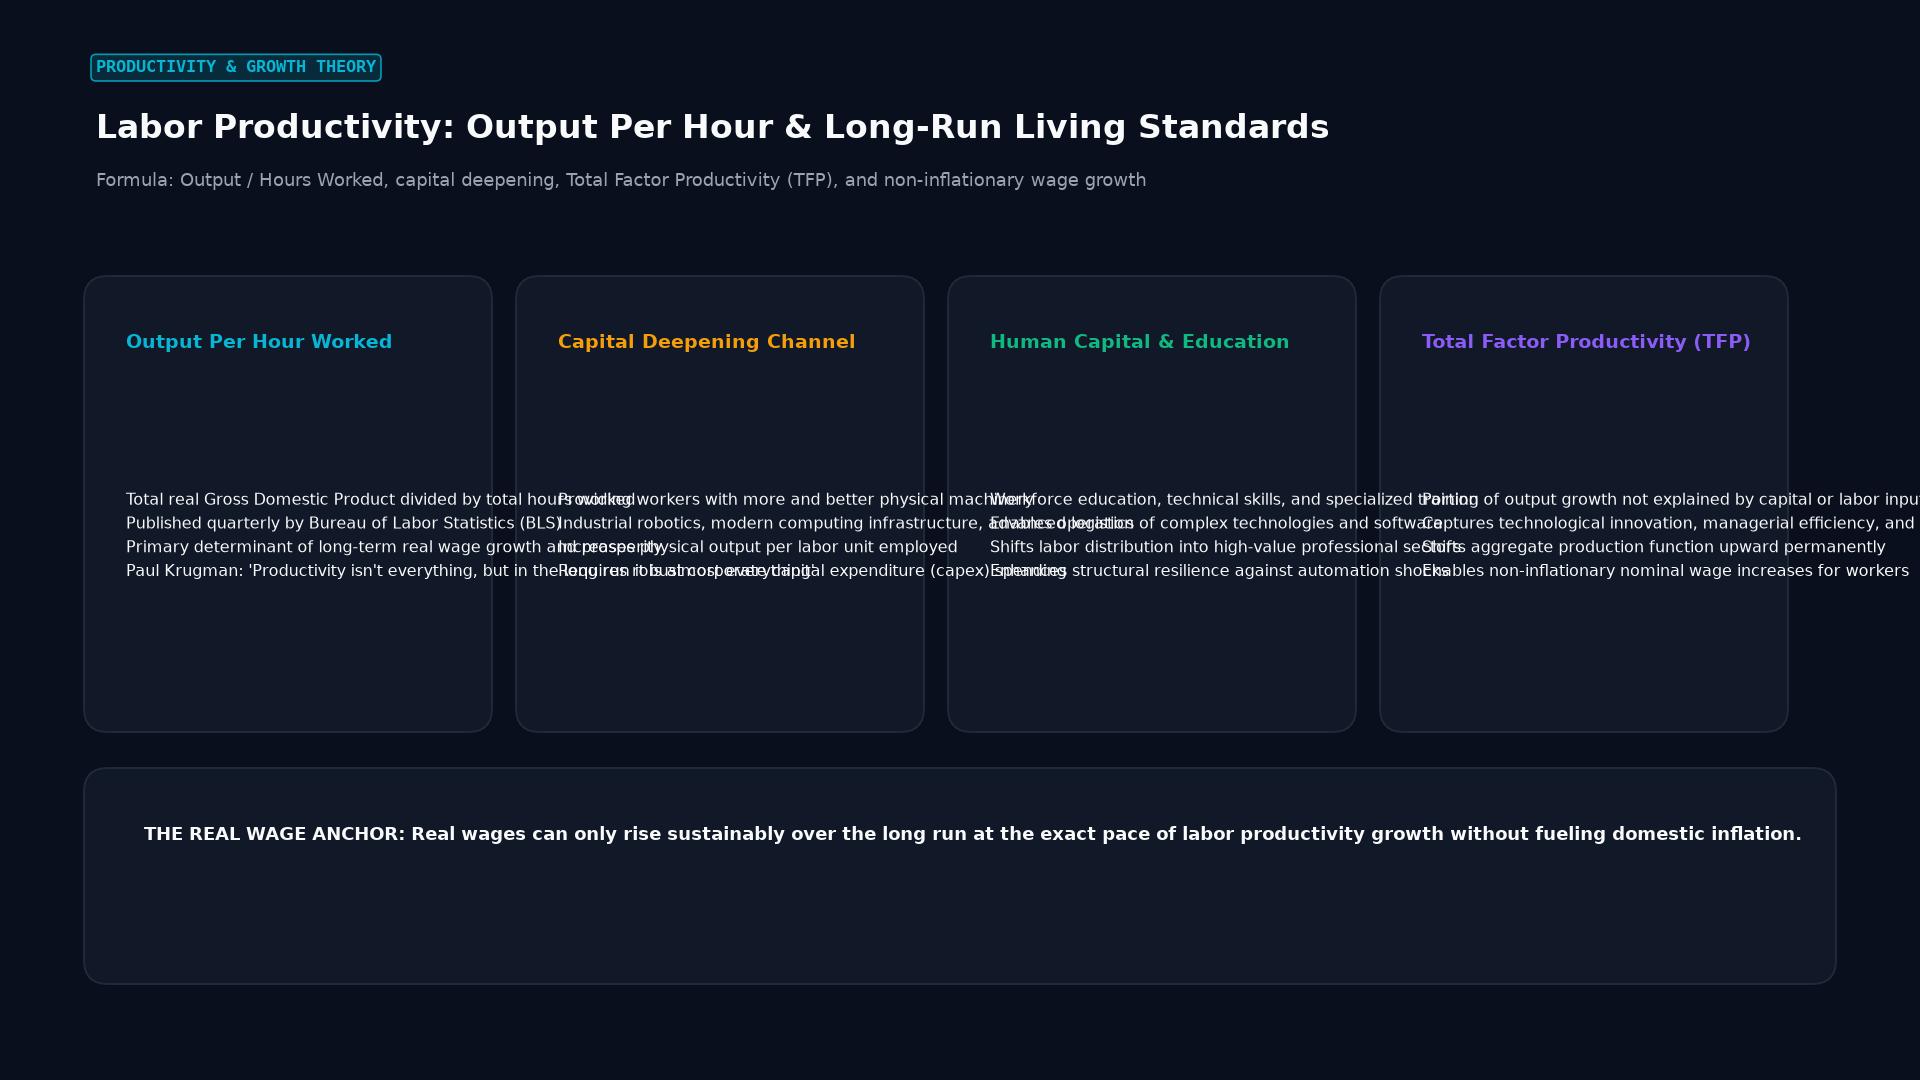 Figure: Formula: Output / Hours Worked, capital deepening, Total Factor Productivity (TFP), and non-inflationary wage growth
Key Takeaways
- The Productivity Equation: Labor productivity is formally defined as $\text{Labor Productivity} = \frac{\text{Real Output (GDP)}}{\text{Labor Hours Worked}}$.
- Unit Labor Costs (ULC): Productivity directly determines Unit Labor Costs—the amount of compensation paid to produce one unit of real output. When wage growth outstrips productivity growth, ULC spikes, fueling core inflation.
- Central Bank Reaction Function: High productivity growth enables the Federal Reserve or European Central Bank (ECB) to tolerate rapid job creation and wage expansion without immediately resorting to aggressive interest rate hikes.
- FX Valuation Implications: Long-term currency appreciation is strongly correlated with a country’s total factor and labor productivity advantage relative to its trading partners (the Balassa-Samuelson effect).
- Technological & Capital Catalysts: Labor productivity gains are propelled primarily by capital deepening (better machines and software), workforce education, and technological breakthroughs like automation and artificial intelligence.
Mathematical Formulation: Productivity and Unit Labor Costs
To understand how foreign exchange algorithms process productivity releases, examine the interplay between productivity, wages, and unit labor costs:
$$\text{Productivity Growth} = \Delta \ln(\text{Real GDP}) - \Delta \ln(\text{Total Hours Worked})$$
$$\text{Unit Labor Costs (ULC)} = \frac{\text{Hourly Labor Compensation}}{\text{Real Output Per Hour}}$$
Taking logarithmic approximations:
$$% \Delta \text{ULC} \approx % \Delta \text{Hourly Compensation} - % \Delta \text{Labor Productivity}$$
Forex Macro Implications:
- Benign Non-Inflationary Growth: If hourly wages rise by 4.0% and labor productivity grows by 3.5%, Unit Labor Costs increase by only 0.5%. Businesses do not need to hike consumer prices to defend margins. This is bullish for the domestic currency as foreign capital seeks profitable, stable equity and bond investments.
- Stagflationary Wage-Price Spiral: If hourly wages rise by 5.0% while labor productivity falls by 1.0%, Unit Labor Costs surge by 6.0%. Central banks must respond with aggressive monetary tightening to crush demand, which initially sparks currency volatility and bond market selloffs.
Comparative Economic Scenarios
| Macro Scenario | Labor Productivity | Wage Growth | Unit Labor Costs (ULC) | Central Bank Stance | Currency (FX) Impact |
|---|---|---|---|---|---|
| Productivity Boom | +3.5% | +4.0% | +0.5% (Stable) | Neutral / Accommodative | Bullish (Foreign FDI & equity inflows) |
| Wage-Push Inflation | +0.2% | +5.5% | +5.3% (Surging) | Aggressive Hikes | Short-term spike on rates; medium-term stagflation drag |
| Stagnation / Malaise | -0.8% | +1.5% | +2.3% (Creeping) | Easing to stimulate | Bearish (Capital outflows to productive economies) |
| Cyclical Recession | -1.5% | +0.5% | +2.0% (Defensive) | Rate cuts & QE | Dependent on safe-haven status (e.g., USD vs Exotics) |
Real-World Case Study: The 1990s US “New Economy” vs. 2020s Trends
During the mid-to-late 1990s, the United States experienced a massive wave of technological investment in telecommunications, computing, and the internet.
- The Data: Between 1995 and 2000, U.S. nonfarm business labor productivity surged from an annualized trend of ~1.5% to over 2.8% per year.
- Federal Reserve Reaction: Fed Chairman Alan Greenspan recognized that official productivity data was undercounting real gains. Despite unemployment plummeting below 4.0% and strong wage gains, Greenspan held interest rates lower than standard Phillips Curve models recommended, anticipating that supply-side efficiency would cap inflation.
- Forex Market Outcome: The U.S. Dollar Index (DXY) experienced an extended multi-year secular bull market, rallying over 30% against European and Asian currencies as global institutional capital flooded into the highly productive U.S. corporate sector.
Limitations and Measurement Challenges
- Service-Sector Measurement Bias: Measuring productivity in manufacturing (e.g., cars assembled per hour) is straightforward, but measuring productivity in knowledge, financial, and healthcare sectors (which comprise over 75% of modern Western economies) is notoriously difficult and subject to heavy revisions.
- Lagging Indicator Characteristics: Labor productivity figures are reported quarterly and frequently revised months after initial release, making them more valuable for long-term structural currency valuation than high-frequency scalping.
- Short-Term Countercyclical Distortion: During recessions, productivity can paradoxically spike because businesses aggressively lay off low-productivity and part-time workers first, artificially inflating the output-per-hour ratio of the remaining workforce.
Frequently Asked Questions (FAQ)
How does a labor productivity release affect spot forex pairs?
When quarterly labor productivity numbers beat consensus expectations and Unit Labor Costs come in moderate, it signals robust, non-inflationary economic growth. This typically strengthens the domestic currency against peers because it reinforces the nation’s competitive export advantage and attracts cross-border portfolio investment.
What is the difference between labor productivity and Total Factor Productivity (TFP)?
Labor productivity isolates output relative specifically to human labor hours. Total Factor Productivity (or Multi-Factor Productivity) measures economic output relative to the combined input of both labor and capital (machinery, software, and physical infrastructure), capturing pure technological and organizational efficiency.
Who publishes labor productivity data in major economies?
In the United States, it is published quarterly by the Bureau of Labor Statistics (BLS) alongside Unit Labor Costs. In the Eurozone, Eurostat compiles and releases productivity indices. In the UK, the Office for National Statistics (ONS) tracks output per hour and output per worker.
Ready to trade forex?
Open a free demo account with a regulated broker. Practice with virtual funds before risking real money.