Leading Indicators
Leading indicators are forward-looking economic and technical metrics that shift prior to the broader economy or underlying asset establishing a new trend, signaling upcoming turning points and cyclical expansions.
What Are Leading Indicators?
Leading indicators are forward-looking measurable variables that consistently change direction in advance of broader economic activity or financial market trends. While coincident indicators describe current conditions and lagging indicators confirm past shifts, leading indicators provide predictive early warnings regarding where the business cycle or asset prices are headed.
In macroeconomic policy and foreign exchange trading, leading indicators provide crucial forward guidance. Institutional investors, currency desks, and central banks monitor leading data sets to anticipate recessions, forecast corporate profit cycles, and project monetary policy adjustments months before they appear in headline GDP or employment figures.
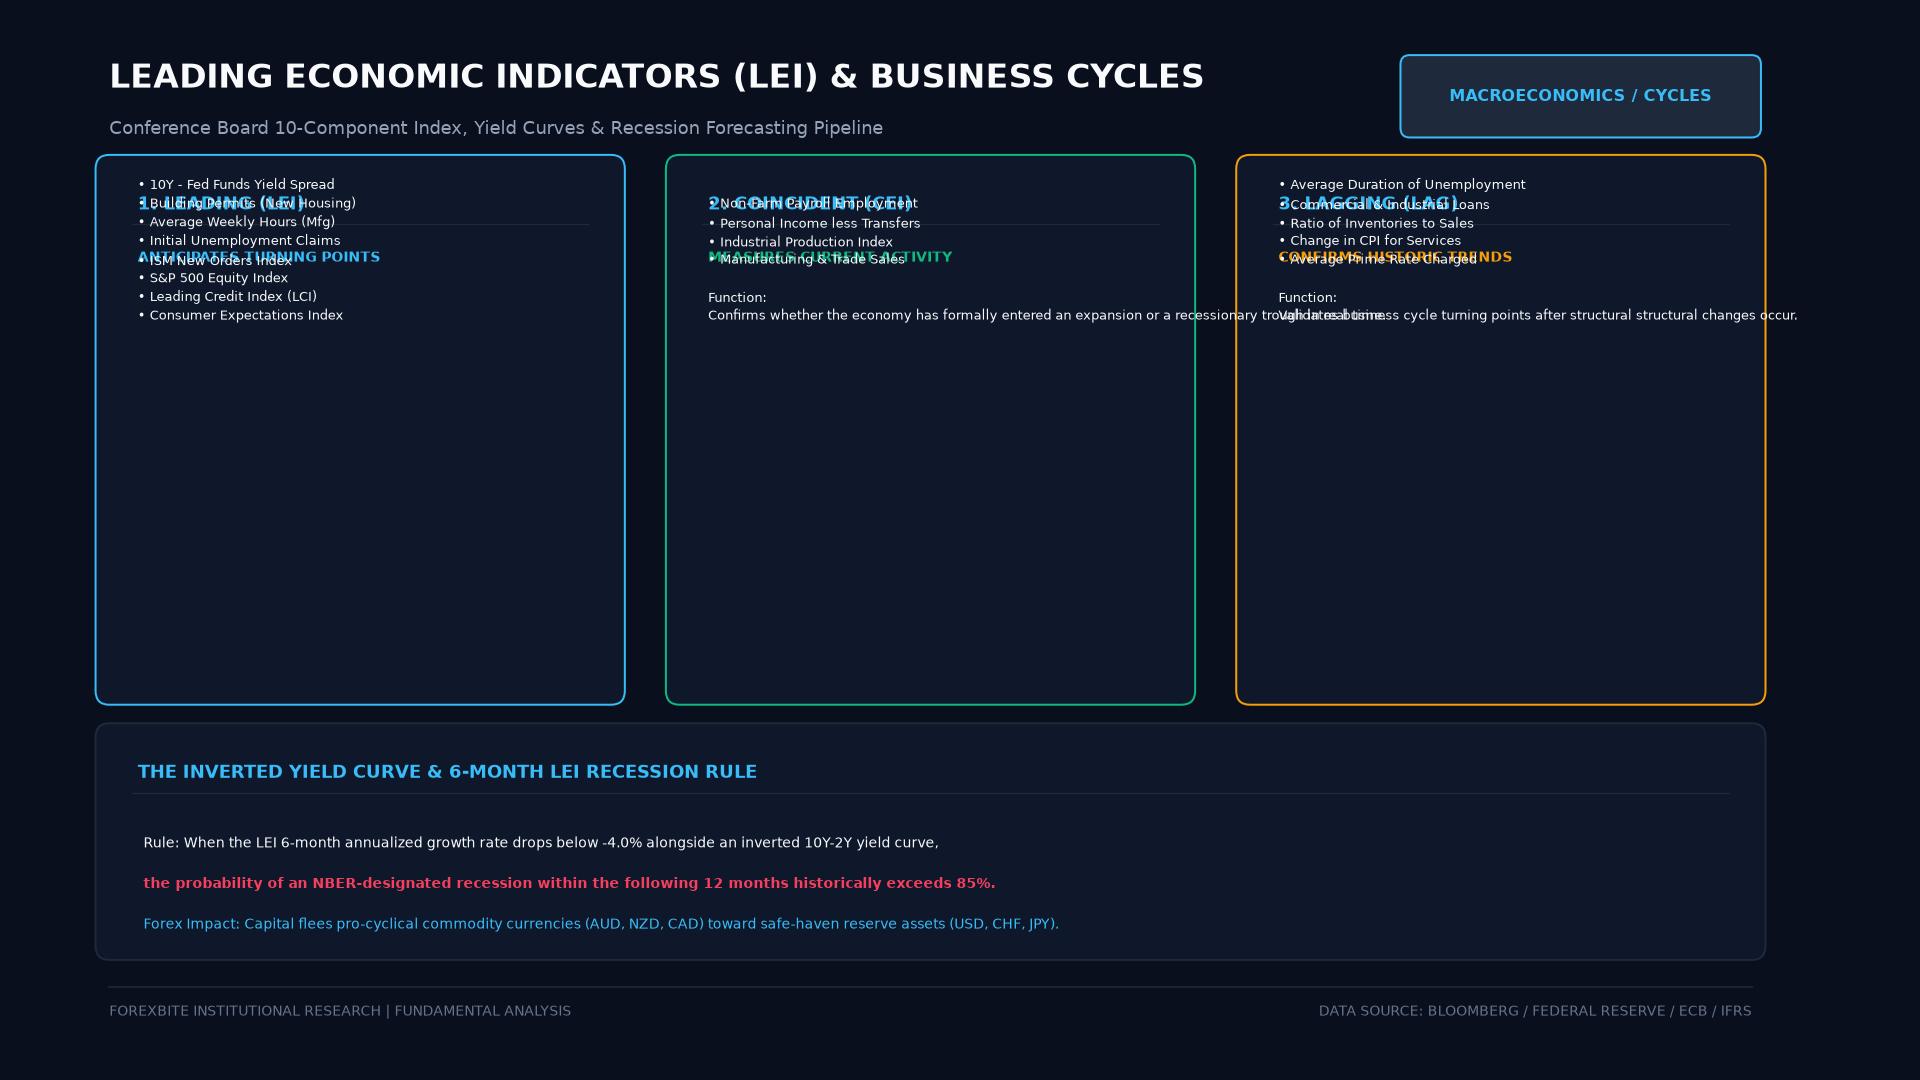 Figure: Classification of business cycle indicators into Leading (LEI 10-component index), Coincident (CEI current output), and Lagging (LAG confirmation metrics), illustrating yield curve inversion and recession forecasting rules.
Primary Macroeconomic Leading Indicators
Economists track several core forward-looking indicators to map the trajectory of the macroeconomic cycle:
1. The Sovereign Yield Curve (10Y – 2Y Spread)
The spread between 10-year and 2-year government bond yields is widely regarded as the financial world’s most reliable recession predictor. During healthy expansions, the yield curve slopes upward (longer debt pays higher yields). When bond markets invert—meaning 2-year yields trade higher than 10-year yields—it signals that investors expect aggressive future rate cuts to fight an impending recession. An inverted yield curve has accurately preceded every US recession for over fifty years, typically by 12 to 18 months.
2. Building Permits and Housing Starts
Residential construction requires significant upfront capital investment and long planning cycles. When mortgage rates rise or consumer confidence falters, applications for new building permits drop sharply months before broader consumer spending contracts.
3. ISM New Orders Index
The New Orders component of the monthly ISM Purchasing Managers’ Index (PMI) tracks future factory commitments. Manufacturers do not produce goods without purchase orders; therefore, expanding new orders precede hiring, raw material purchases, and transportation demand.
4. Weekly Initial Jobless Claims
Unlike the monthly Non-Farm Payrolls report, initial jobless claims are published every Thursday morning in the United States. A sustained multi-week uptrend in new unemployment claims serves as an immediate, real-time warning that corporate profit margins are deteriorating and layoffs are accelerating.
5. The Conference Board Leading Economic Index (LEI)
The LEI is a composite index aggregating ten distinct leading variables—including average weekly manufacturing hours, stock prices (S&P 500), consumer expectations, credit conditions, and interest rate spreads—providing a single normalized index of future economic trajectory.
Technical Leading Indicators in Chart Analysis
In technical market analysis, chartists deploy mathematical oscillators designed to lead price action and anticipate exhaustion:
| Technical Indicator | Predictive Mechanism | Core Trading Signal |
|---|---|---|
| Relative Strength Index (RSI) | Measures velocity of price gains vs. losses | Identifies overbought (>70) and oversold (<30) exhaustion zones. |
| Stochastic Oscillator | Compares closing price to recent high-low range | Crossovers in extreme zones signal imminent momentum deceleration. |
| Price/Oscillator Divergence | Price makes a higher high, but oscillator prints a lower high | Warns of underlying momentum failure before price actively reverses. |
| Fibonacci Projections | Mathematical ratio measurements (1.272, 1.618) | Projects future support/resistance levels before price reaches them. |
The Vulnerability of Leading Indicators: False Signals
While leading indicators provide early warning capability, their predictive nature makes them prone to false alarms (whipsaws):
- Staying Pinned in Strong Trends: In a violent macro bull trend, an oscillator like RSI can stay “overbought” above 70 for weeks while the currency pair rallies hundreds of pips higher. Selling prematurely based solely on a leading indicator can result in severe drawdowns.
- Variable Time Lags: The yield curve may invert 6 months before a recession—or 24 months before. Trading against the prevailing trend too early based on leading macro data exposes traders to immense carrying costs.
Comparison of Economic Indicator Types
| Dimension | Leading Indicators | Coincident Indicators | Lagging Indicators |
|---|---|---|---|
| Timing | Ahead of the cycle | Simultaneous with cycle | Behind the cycle |
| Primary Utility | Forecasting & anticipation | Benchmarking current health | Validating established trends |
| False Signal Risk | High | Low | Very Low |
| Core Examples | Yield Curve, Permits, RSI | Industrial Production, Retail Sales | Unemployment Rate, CPI |
Key Takeaways
- Leading indicators change direction before the broader economy or asset prices establish a new trend.
- The inverted yield curve (10-2 spread) is the premier macroeconomic recession predictor.
- Building permits and ISM new orders provide early insight into corporate and consumer demand.
- Technical oscillators (RSI, Stochastic) identify momentum exhaustion and potential reversal zones.
- Leading indicators require confirmation from lagging metrics to avoid costly false breakout whipsaws.
Frequently Asked Questions
Why do stock markets act as a leading indicator for the economy?
Equity markets are forward-looking pricing mechanisms. Institutional investors trade based on anticipated corporate earnings over the next 6 to 12 months rather than past performance, causing equity markets to bottom and rally several months before real GDP exits a recession.
How should forex traders use leading indicators?
Forex traders use leading indicators (like divergence or overbought/oversold levels) to identify where a trend may be losing steam, but wait for price action confirmation (such as a break of market structure or moving average cross) before executing an entry.
What is the difference between leading and coincident indicators?
Leading indicators forecast where the economy is going in the future (e.g., building permits). Coincident indicators measure real-time economic activity occurring right now (e.g., monthly industrial production, non-farm payrolls, and retail sales).
Ready to trade forex?
Open a free demo account with a regulated broker. Practice with virtual funds before risking real money.