MACD Histogram
The MACD histogram is a visual technical indicator that plots the mathematical spread between the MACD line and its signal line, giving traders early warnings of momentum acceleration, deceleration, and impending trend reversals.
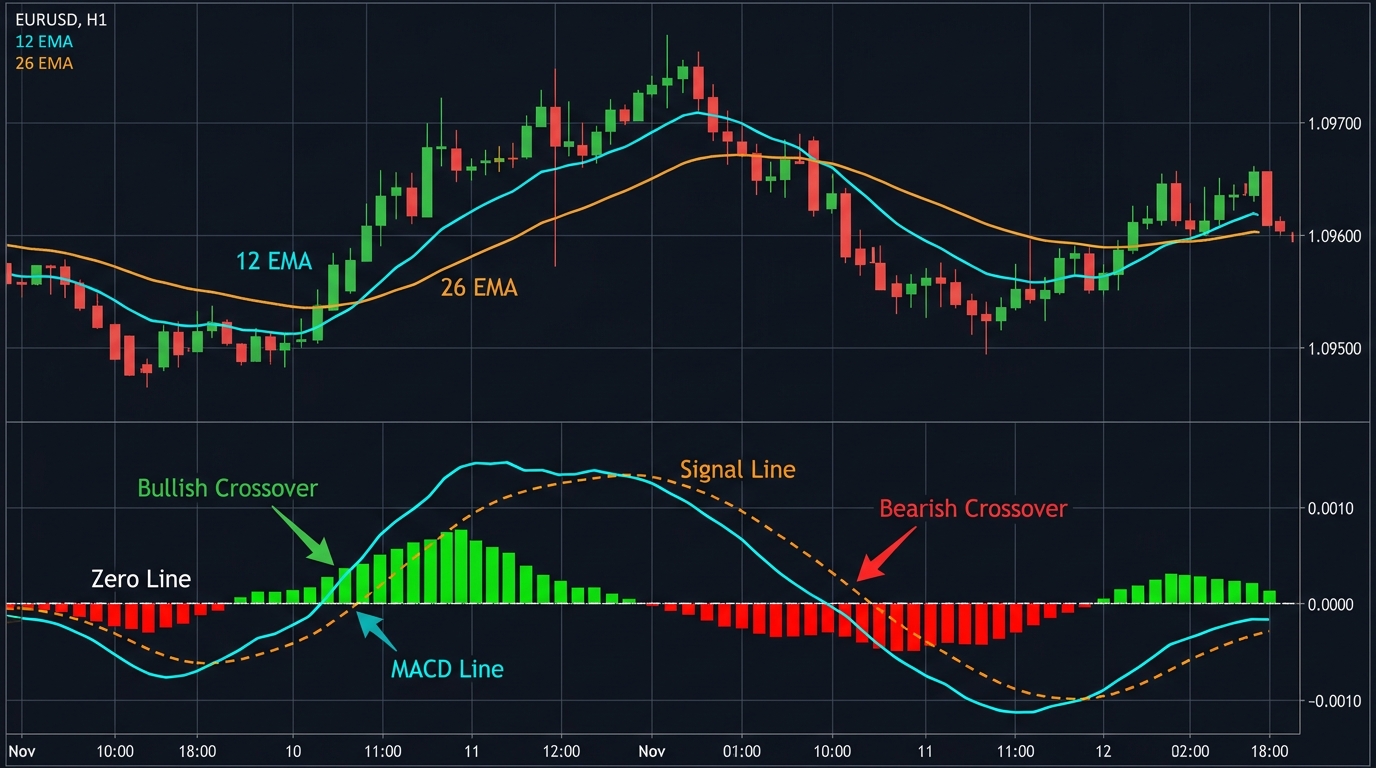
Developed by Thomas Aspray in 1986 as an enhancement to Gerald Appel’s original Moving Average Convergence Divergence (MACD) indicator, the MACD histogram measures the distance between the MACD line and its signal line. While the standard MACD line and signal line provide reliable crossover triggers, they inevitably lag price action because they rely on moving averages.
The histogram solves this latency problem. By plotting the rate of convergence and divergence between the two lines as vertical bars around a central zero line, it reveals changes in momentum before the lines actually cross.
Mathematical Construction of the MACD Histogram
The MACD histogram derives from three core mathematical steps:
-
The MACD Line: Calculated by subtracting a longer-term exponential moving average from a shorter-term exponential moving average (traditionally the 12-period and 26-period EMAs of closing prices): $$\text{MACD Line} = \text{EMA}{12}(\text{Close}) - \text{EMA}{26}(\text{Close})$$
-
The Signal Line: An exponential moving average of the MACD line itself (traditionally a 9-period EMA): $$\text{Signal Line} = \text{EMA}_9(\text{MACD Line})$$
-
The MACD Histogram: The direct arithmetic difference between the MACD line and the signal line: $$\text{MACD Histogram} = \text{MACD Line} - \text{Signal Line}$$
Reading the Histogram Bars
- Above the Zero Line: Indicates that the MACD line is above its signal line. Bullish momentum dominates.
- Below the Zero Line: Indicates that the MACD line is below its signal line. Bearish momentum dominates.
- Expanding Bars: When the histogram bars grow taller (whether positive or negative), momentum is accelerating in that direction.
- Shrinking Bars: When the histogram bars begin contracting toward the zero line, momentum is decelerating. This contraction occurs days or hours before the actual moving average crossover takes place.
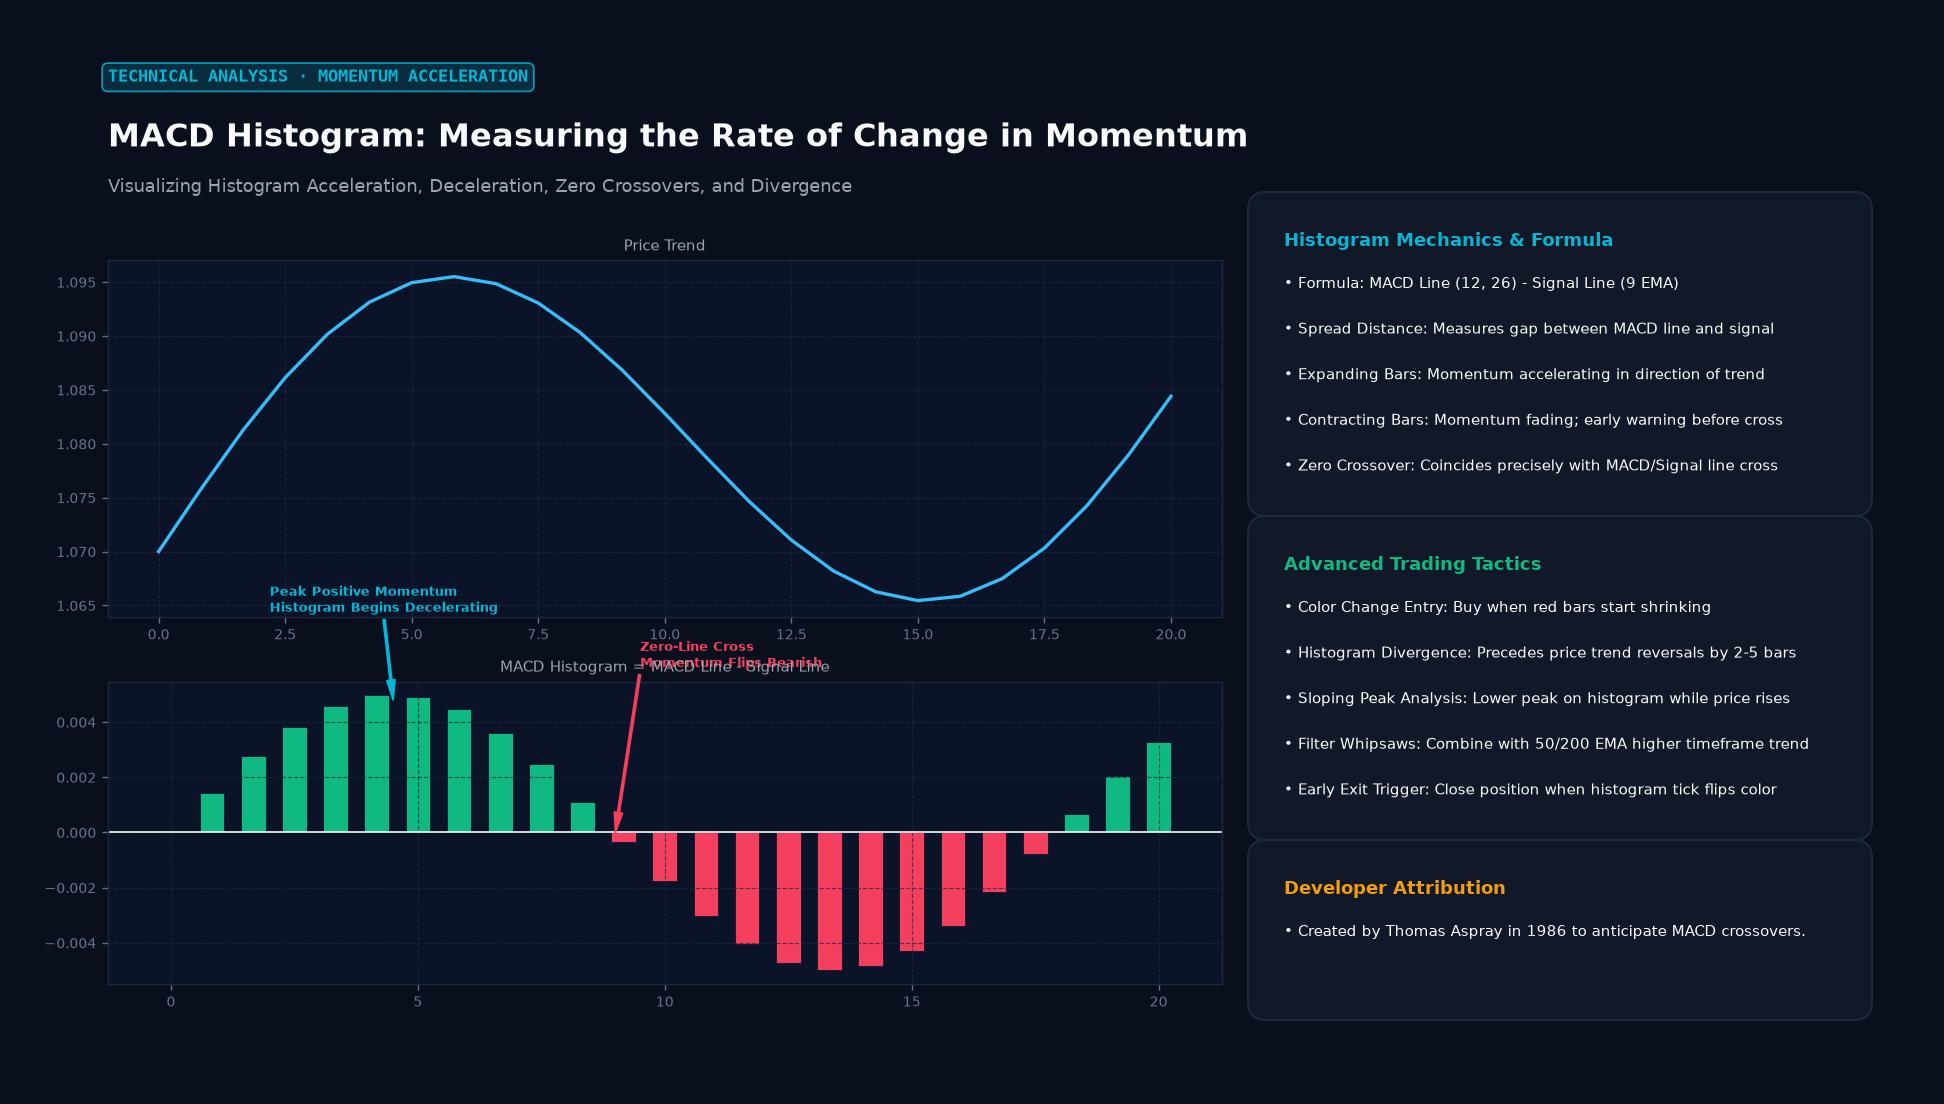 Figure: Visualizing Histogram Acceleration, Deceleration, Zero Crossovers, and Divergence
How Traders Use the MACD Histogram
| Signal Type | Market Condition | Technical Trigger | Trader Action |
|---|---|---|---|
| Zero-Line Cross | Momentum shift confirmed | Histogram flips from negative to positive (or positive to negative) | Confirms an active MACD/Signal line crossover entry |
| Histogram Peak / Trough | Momentum exhaustion | Tall positive bar followed by a shorter bar while price still climbs | Prepares for trade exit or contrarian reversal entry |
| Bullish Divergence | Exhausted selling pressure | Price forms a lower low while histogram prints a higher low | Initiates early long position or tightens short stops |
| Bearish Divergence | Exhausted buying pressure | Price prints a higher high while histogram prints a lower peak | Initiates early short position or tightens long stops |
Trading Divergence on the MACD Histogram
Divergence between price action and the MACD histogram is one of the most reliable reversal patterns in technical analysis. Because the histogram represents the second derivative of price (the acceleration of price changes), divergence here appears significantly earlier than on the RSI or stochastic oscillators.
Regular Bearish Divergence
When an exchange rate establishes a higher swing high on the chart, but the corresponding MACD histogram peak is noticeably lower than the previous peak, upward price acceleration has broken down. The rally is being sustained on diminishing institutional volume and slowing velocity.
Regular Bullish Divergence
When price drops to a fresh swing low, but the MACD histogram forms a shallower valley (a higher low below zero), downside velocity is drying up. This indicates that sellers are losing control, often preceding an explosive corrective bounce.
Practical Example: Spotting a Reversal on EUR/USD
Imagine EUR/USD rallying on a 4-hour chart toward a heavy resistance level at 1.0950:
- First Peak: The currency pair touches 1.0920, and the MACD histogram reaches an extreme positive peak of $+0.0035$. Price pulls back to 1.0870 for consolidation.
- Second Peak (Price Higher, Momentum Lower): A week later, bulls push EUR/USD higher to test 1.0955. However, the MACD histogram rises only to $+0.0014$.
- Interpreting the Divergence: Even though the exchange rate pushed 35 pips beyond its previous high, momentum was less than half as strong. The MACD line is rapidly converging toward its signal line.
- Execution: The trader waits for the histogram to produce its first contracting bar below the $+0.0014$ peak and enters a short position at 1.0930.
- Stop-Loss: Placed above the structural swing high at 1.0970 (risking 40 pips).
- Take-Profit: Targeted at the 1.0810 daily support zone (targeting 120 pips).
- Result: EUR/USD rolls over, the histogram crosses below zero, and the MACD lines complete their bearish cross shortly thereafter, confirming the 3:1 reward-to-risk trade.
Limitations and False Signals
While the MACD histogram provides early alerts, its sensitivity makes it susceptible to whipsaws in sideways or low-volatility regimes:
- Strong Secular Trends: During powerful macroeconomic trend runs (such as prolonged central bank rate hike cycles), multiple consecutive divergences can form without reversing the trend. Fading every divergence in a runaway market leads to severe losses.
- Choppy Consolidation: When prices oscillate inside a narrow rectangle, the histogram repeatedly crosses back and forth over the zero line, generating false breakout triggers.
- Confirmation Requirement: Professional traders rarely trade the histogram in isolation. They combine histogram turns with candlestick reversal patterns, key horizontal support/resistance levels, or volume profile data.
Key Takeaways
- Momentum Leading Indicator: The MACD histogram measures the distance between the MACD line and its 9-period signal line, anticipating crossovers before they occur.
- Acceleration vs. Velocity: Expanding bars indicate accelerating trend speed; contracting bars indicate decelerating momentum.
- Divergence Power: Discrepancies between price swing highs/lows and histogram peaks/troughs provide early alerts of impending market exhaustion.
- Zero-Line Significance: A zero-line cross on the histogram corresponds to an exact moving average crossover between the MACD and signal lines.
- Trend Context: Histogram divergence signals require confirmation from price structure, as powerful macro trends can easily override early momentum divergence.
Frequently Asked Questions
What is the difference between the MACD line and the MACD histogram?
The MACD line is the difference between two exponential moving averages (12 EMA minus 26 EMA). The MACD histogram is the difference between that MACD line and its 9-period signal line. The MACD line shows trend direction, while the histogram shows the rate at which momentum is changing.
Why do histogram peaks precede price reversals?
Because the histogram measures the momentum of moving averages, it reflects acceleration. Just as a car must decelerate before coming to a stop and reversing direction, price velocity slows down before a market reversal. The histogram captures this deceleration before the reversal shows up in moving average crossovers.
Can the MACD histogram be used on lower timeframes?
Yes, day traders frequently apply the MACD histogram on 5-minute and 15-minute charts to spot momentum exhaustion into intraday support and resistance levels. However, lower timeframes produce more market noise, requiring stricter risk controls.
Ready to trade forex?
Open a free demo account with a regulated broker. Practice with virtual funds before risking real money.