New Home Sales
New Home Sales is a high-impact leading macroeconomic indicator that measures the annualized number of newly constructed single-family homes with signed sales contracts across the United States during a given month.
What Is the New Home Sales Report?
New Home Sales (officially published by the U.S. Census Bureau and the Department of Housing and Urban Development [HUD] as the New Residential Sales report) is one of the financial market’s premier leading indicators of consumer confidence, credit health, and forward macroeconomic momentum. Released monthly around the 24th to 26th of the following month, the report measures the number of newly built single-family homes sold across four major U.S. geographical regions (Northeast, Midwest, South, and West).
In foreign exchange (Forex) and bond markets, New Home Sales is closely monitored because of the immense multiplier effect housing exerts on the broader economy. Residential housing activity represents approximately 15% to 18% of U.S. Gross Domestic Product (GDP) through direct residential investment and downstream consumer spending. A sustained expansion in new home sales signals robust employment, strong wage growth, and healthy consumer credit, directly influencing the Federal Reserve’s monetary policy decisions and driving cyclical trends in the U.S. Dollar (USD).
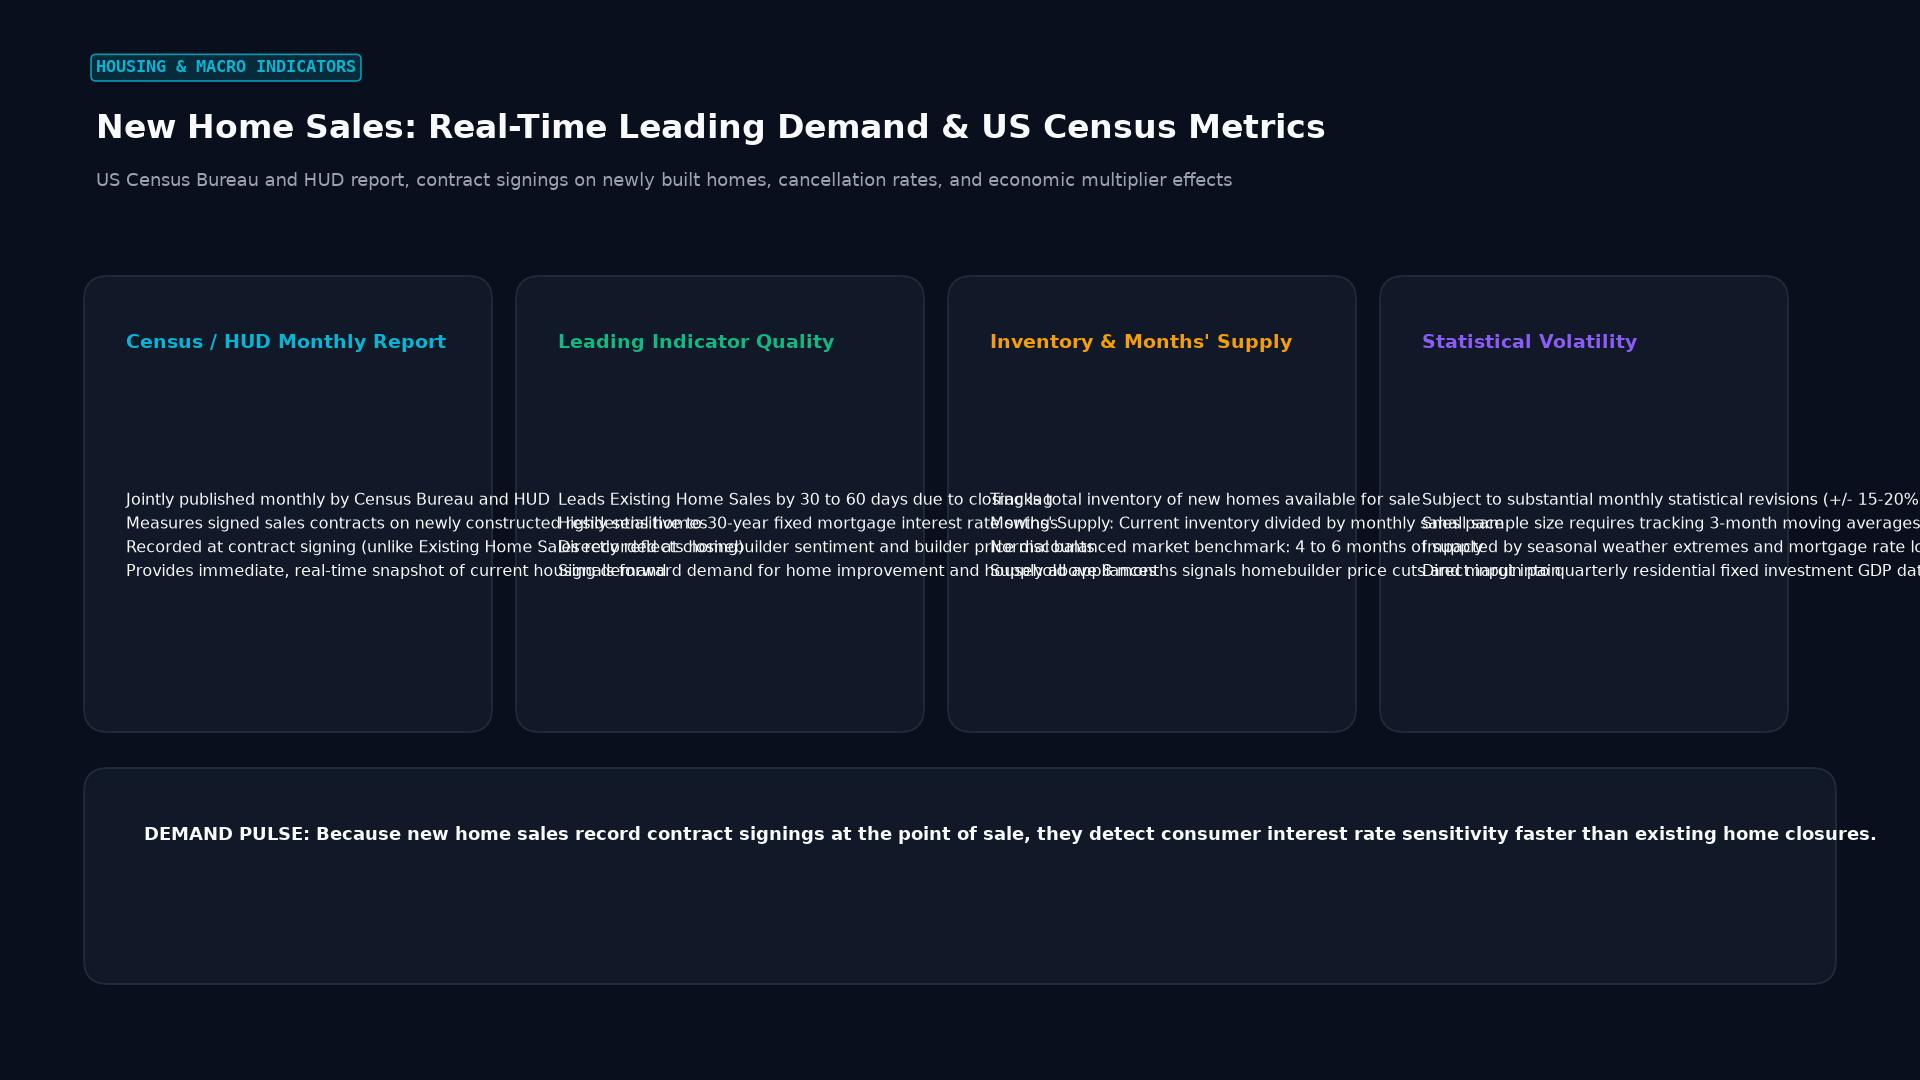 Figure: US Census Bureau and HUD report, contract signings on newly built homes, cancellation rates, and economic multiplier effects
Key Takeaways
- True Leading Indicator: A new home sale is recorded at the signing of the sales contract (often before the house is even built), making it a forward-looking leading indicator, unlike Existing Home Sales, which records at final settlement closing.
- Seasonally Adjusted Annual Rate (SAAR): Data is presented as an annualized rate—the number of homes that would be sold over an entire year if the current month’s pace continued for 12 months.
- Extreme Interest Rate Sensitivity: Because home purchases depend heavily on 30-year fixed mortgage rates, the report acts as a sensitive barometer of the Federal Reserve’s monetary tightening or easing cycles.
- The Months’ Supply Metric: Tracks how long current builder inventory would last at the prevailing sales pace. A normal, balanced market maintains 4 to 6 months of inventory; levels above 8 months signal severe builder distress and impending price cuts.
- High Statistical Volatility: Due to sampling error, initial New Home Sales prints are subject to massive historical revisions in subsequent months (often $\pm 10%$ to $\pm 15%$).
Comparative Taxonomy: The U.S. Housing Indicator Matrix
Understanding the sequential timeline of real estate indicators allows macro analysts to track the housing cycle from inception to final settlement.
| Housing Report | Publishing Agency | Measurement Point | Indicator Classification | Market Volume Share |
|---|---|---|---|---|
| Building Permits | U.S. Census Bureau | Government authorization to build | Leading | Earliest signal of future construction |
| Housing Starts | U.S. Census Bureau | Breaking ground / foundation poured | Leading | Measures physical industrial activity |
| New Home Sales | U.S. Census / HUD | Contract signed + deposit made | Leading | ~10% of total U.S. home sales |
| Existing Home Sales | Nat. Assoc. of Realtors | Final deed closing at bank | Coincident / Lagging | ~90% of total U.S. home sales |
Key Metrics Included in the Report
The Census Bureau’s monthly release contains three primary variables scrutinized by foreign exchange algorithms:
- Annualized Headline Sales (SAAR): The benchmark headline figure, typically ranging historically between 500,000 and 1,000,000 units annually.
- Median vs. Average Sales Price:
- Median Price: The midpoint price where 50% of homes sold for more and 50% for less. Preferred by economists because it is not distorted by ultra-luxury mega-mansion sales.
- Average Price: The total dollar volume divided by units sold; tends to be 10% to 20% higher than the median.
- Months’ Supply of Inventory:
$$\text{Months’ Supply} = \frac{\text{Total Unsold Homes at Month End}}{\text{Monthly Sales Volume}}$$
- Below 4.0 Months: Undersupply; powerful upward pressure on home prices.
- Above 7.0 Months: Oversupply; builders must offer price cuts and mortgage rate buy-downs.
Real-World Case Study: The 2022–2023 Mortgage Rate Shock
When the Federal Reserve raised benchmark interest rates from 0.00% to 5.25% between 2022 and 2023, standard 30-year U.S. fixed mortgage rates surged from 3.0% to over 7.8%—the fastest doubling in modern history.
- The Lock-In Effect in Existing Homes: Existing homeowners with locked-in 3% mortgages refused to sell, causing existing home inventory to collapse by over 30%.
- The New Home Sales Pivot: Prospective buyers were forced to turn to commercial homebuilders (such as D.R. Horton and Lennar). Because public builders possessed strong corporate balance sheets, they offered lucrative mortgage rate buy-downs (subsidizing buyer mortgages down to 5.5%).
- The Data Surprise: While Wall Street economists predicted a catastrophic collapse in New Home Sales, the index proved remarkably resilient, rebounding from 550,000 to over 700,000 units by mid-2023.
- Forex Market Reaction: This surprising strength in homebuilding convinced the Federal Reserve that the U.S. economy could withstand higher-for-longer interest rates without a recession, fueling persistent upward momentum in the U.S. Dollar Index (DXY) against the Euro and Japanese Yen.
Trading Pitfalls and News Release Traps
- Trading the Initial Headline Release: Novice forex traders who scalp the initial release often get caught in sudden whipsaws. A report showing headline sales beating expectations by +5% is frequently accompanied by a -7% downward revision to the prior month’s data, causing the currency to reverse violently.
- Weather Distortions: Winter blizzards in the Northeast or severe hurricanes in the South can artificially depress new home contract signings for a month, followed by an artificial springtime rebound that reflects deferred transactions rather than true structural demand shifts.
Frequently Asked Questions (FAQ)
Why does New Home Sales move markets more than Existing Home Sales if it represents only 10% of the market?
New Home Sales moves financial markets more aggressively because it is a pure leading indicator captured at the exact moment a buyer signs a contract and commits cash. Existing Home Sales records at closing (often 30 to 60 days after the contract was signed), meaning it reflects decisions made months earlier.
How does a strong New Home Sales print affect EUR/USD?
When New Home Sales comes in significantly above consensus expectations, it indicates economic vitality and persistent consumer demand. This increases the likelihood that the Federal Reserve will maintain higher interest rates, typically triggering an immediate selloff in EUR/USD (a stronger U.S. Dollar).
What is the difference between New Home Sales and Housing Starts?
Housing Starts measures the number of residential units that have begun physical excavation or foundation pouring. New Home Sales measures the commercial transaction—the formal legal sale of a single-family house to an end buyer.
Ready to trade forex?
Open a free demo account with a regulated broker. Practice with virtual funds before risking real money.