Producer Price Index (PPI)
The Producer Price Index (PPI) is a key macroeconomic indicator that measures the average change over time in the selling prices received by domestic producers for their output, serving as a critical leading indicator of wholesale inflation and consumer price (CPI) trends.
What Is the Producer Price Index (PPI)?
The Producer Price Index (PPI)—published monthly in the United States by the Bureau of Labor Statistics (BLS)—is a family of benchmark economic indices that measures the average change over time in selling prices received by domestic producers for their output across manufacturing, agriculture, mining, and services sectors.
While the widely followed Consumer Price Index (CPI) measures price inflation from the perspective of the buyer (the household consumer at the retail checkout counter), the PPI measures inflation from the perspective of the seller (the factory gate or primary producer). Because rising production, raw material, and wholesale costs are typically passed down through supply chains to end-consumers, the PPI serves as one of the most powerful leading indicators of consumer inflation (CPI) and central bank monetary policy shifts.
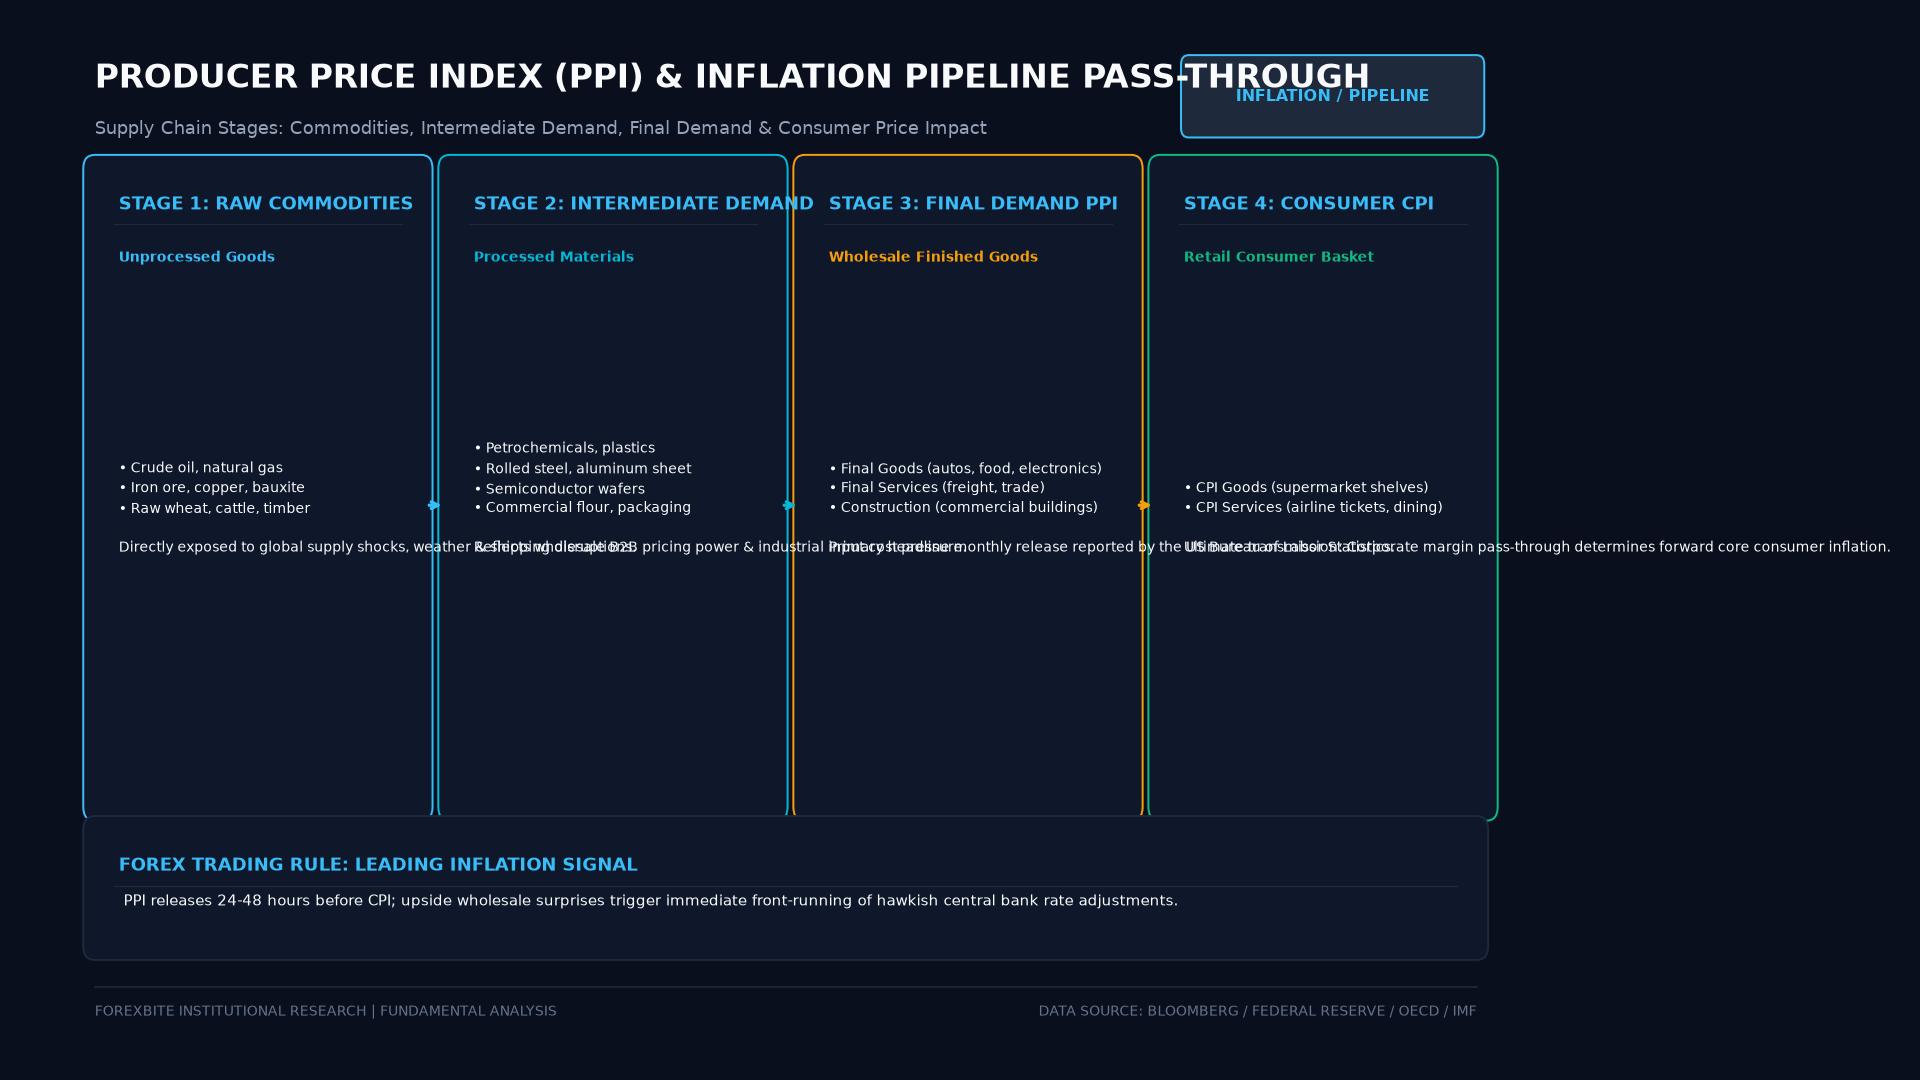 Figure: Multi-stage pipeline inflation transmission model from Raw Commodities through Intermediate Demand and Final Demand PPI to Consumer Price Index (CPI) retail pass-through.
Structure of the Modern PPI: The Final Demand-Intermediate Demand (FD-ID) Model
In 2014, the BLS restructured the PPI from the legacy “Stage-of-Processing” system to the comprehensive Final Demand-Intermediate Demand (FD-ID) framework:
1. Final Demand PPI (Headline PPI)
Measures price changes for goods, services, and construction sold for personal consumption, capital investment, government purchases, or export. Headline Final Demand PPI is the primary number reported in financial media headlines and monitored on economic calendars:
- Final Demand Goods (approx. 33%): Energy, food, and finished industrial goods.
- Final Demand Services (approx. 65%): Wholesale and retail trade margins, transportation, healthcare, and financial services.
- Final Demand Construction (approx. 2%): Non-residential building construction.
2. Core Final Demand PPI (Core PPI)
Because food and energy commodities are notoriously volatile due to geopolitical supply shocks or seasonal weather, economists track Core PPI (Final Demand excluding Foods, Energy, and Trade Services). Core PPI provides a cleaner, smoother measure of underlying structural wholesale inflationary pressures.
3. Intermediate Demand PPI
Measures price changes for goods and services sold to other businesses as inputs for further production (e.g., steel sold to an automotive assembly plant). Tracking Intermediate Demand allows macro analysts to detect price pressures building up in the production “pipeline” months before they manifest in finished goods.
PPI vs. CPI: Key Structural Differences
Foreign exchange traders and macro investors analyze the divergence between PPI and CPI to evaluate corporate profit margins:
| Macroeconomic Dimension | Producer Price Index (PPI) | Consumer Price Index (CPI) |
|---|---|---|
| Perspective | Seller / Producer: Revenue received at factory gate. | Buyer / Consumer: Out-of-pocket prices paid at retail. |
| Price Valuation | Excludes sales and excise taxes; includes subsidies. | Includes retail sales taxes and excise taxes paid by buyers. |
| Housing / Shelter | Excludes residential rents and owner-occupied housing. | Heavy weighting (~34%): Dominated by Owners’ Equivalent Rent. |
| Leading vs. Lagging | Leading Indicator: Reflects wholesale input price pressures. | Lagging Indicator: Measures realized downstream retail inflation. |
| Corporate Margin Signal | If $\text{PPI} > \text{CPI}$, corporate profit margins are being squeezed. | If $\text{CPI} > \text{PPI}$, companies successfully pass on price markups. |
$$\text{Corporate Margin Pressure} \iff \Delta \text{PPI} - \Delta \text{CPI} > 0$$
Market Reaction Function: How PPI Impacts Spot Forex
The monthly PPI release (typically published at 8:30 AM EST, 24 to 48 hours prior to the CPI release) generates substantial volatility across currency pairs, bond yields, and equity index futures:
- Upside Surprise (PPI Actual > Consensus): Wholesale inflation is running hot. Traders price in an increased probability that the Federal Reserve will maintain high interest rates or deliver aggressive hikes. US Treasury yields rise, and the US Dollar (USD) appreciates against major currencies (e.g., EUR/USD and GBP/USD fall).
- Downside Surprise (PPI Actual < Consensus): Wholesale input costs are cooling rapidly. Traders anticipate lower future CPI prints and potential central bank rate cuts. Bond yields fall, equity markets rally on margin relief, and the US Dollar depreciates.
Real-World Case Study: The Post-Pandemic Supply Chain PPI Explosion (2021–2022)
Following the 2020 pandemic reopening, global supply chains suffered historic bottlenecks, maritime freight container shortages, and soaring energy prices:
- The Wholesale Surge: In late 2021, US Final Demand PPI surged at unprecedented annualized rates, hitting 10.0% year-over-year in November 2021 and peaking at 11.7% in March 2022—the highest rate recorded since the BLS began calculating the series in 2010.
- The Transmission to CPI: Initially, central banks declared inflation to be “transitory.” However, because Intermediate Goods PPI had exploded by over 20%, manufacturers were forced to pass wholesale costs to retailers. Within four months, headline US CPI followed the PPI upward, reaching 9.1% in June 2022.
- The Forex Trade: Institutional macro desks recognizing that the PPI surge would inevitably infect the CPI aggressively initiated long USD positions. The US Dollar Index (DXY) rallied over 15% between January and September 2022, rewarding traders who tracked upstream pipeline inflation.
       2021-2022 PPI-TO-CPI PIPELINE INFLATION EXPLOSION

 [Nov 2021]  Final Demand PPI Surges to 10.0% YoY (Upstream Factory Shock)
                               |
                               v (Cost Pass-Through to Consumers)
 [June 2022] Headline CPI Reaches 40-Year High of 9.1% YoY
                               |
                               v (Monetary Policy Reaction)
 [July 2022] Federal Reserve Enacts Serial Jumbo 75 bps Rate Hikes
                               |
                               v
             US Dollar Index (DXY) Surpasses 114.00 Peak
Frequently Asked Questions
Which component of the PPI is most important to forex traders?
Forex traders pay the closest attention to the Month-over-Month (MoM) Final Demand PPI and Core Final Demand PPI (excluding food, energy, and trade services). Because financial markets trade on marginal changes relative to expectations, a 0.3% beat or miss against consensus estimates will trigger instant repricing in short-term interest rate futures and spot currency pairs.
Does the PPI include imported goods?
No. The Producer Price Index measures only the prices received by domestic producers for goods and services manufactured or provided within the United States. Prices of imported goods are measured separately by the BLS through the Import Price Index.
Why can PPI fall while CPI continues to rise?
PPI and CPI can temporarily decouple due to structural differences in their baskets. For example, if crude oil prices collapse, the PPI drops immediately because energy and industrial manufacturing carry heavy weights in wholesale production. However, if residential housing rents (Owners’ Equivalent Rent) continue to rise, CPI may remain elevated because shelter accounts for over one-third of the consumer index but is entirely absent from PPI.
Ready to trade forex?
Open a free demo account with a regulated broker. Practice with virtual funds before risking real money.