Put/Call Ratio
The Put/Call Ratio (PCR) is a widely monitored market sentiment indicator calculated by dividing the aggregate trading volume or open interest of put options by call options over a given period, utilized primarily as a contrarian gauge to identify market extremes of fear and greed.
What Is the Put/Call Ratio (PCR)?
The Put/Call Ratio (PCR) is one of the most prominent quantitative sentiment indicators in derivatives and equity markets. First popularized by legendary options trader Martin Zweig in the early 1970s, the ratio measures the relative trading activity between put options (which convey the right to sell and represent bearish sentiment or downside hedging) and call options (which convey the right to buy and represent bullish sentiment).
Mathematically, the indicator is expressed as:
$$\text{Put/Call Ratio (Volume)} = \frac{\text{Total Put Volume Traded}}{\text{Total Call Volume Traded}}$$
$$\text{Put/Call Ratio (Open Interest)} = \frac{\text{Total Open Interest of Puts}}{\text{Total Open Interest of Calls}}$$
A shifting PCR alerts market participants to changes in aggregate market psychology. When excessive fear or optimism drives the ratio to historical statistical extremes, quantitative analysts and contrarian traders use the signal to anticipate imminent market reversals.
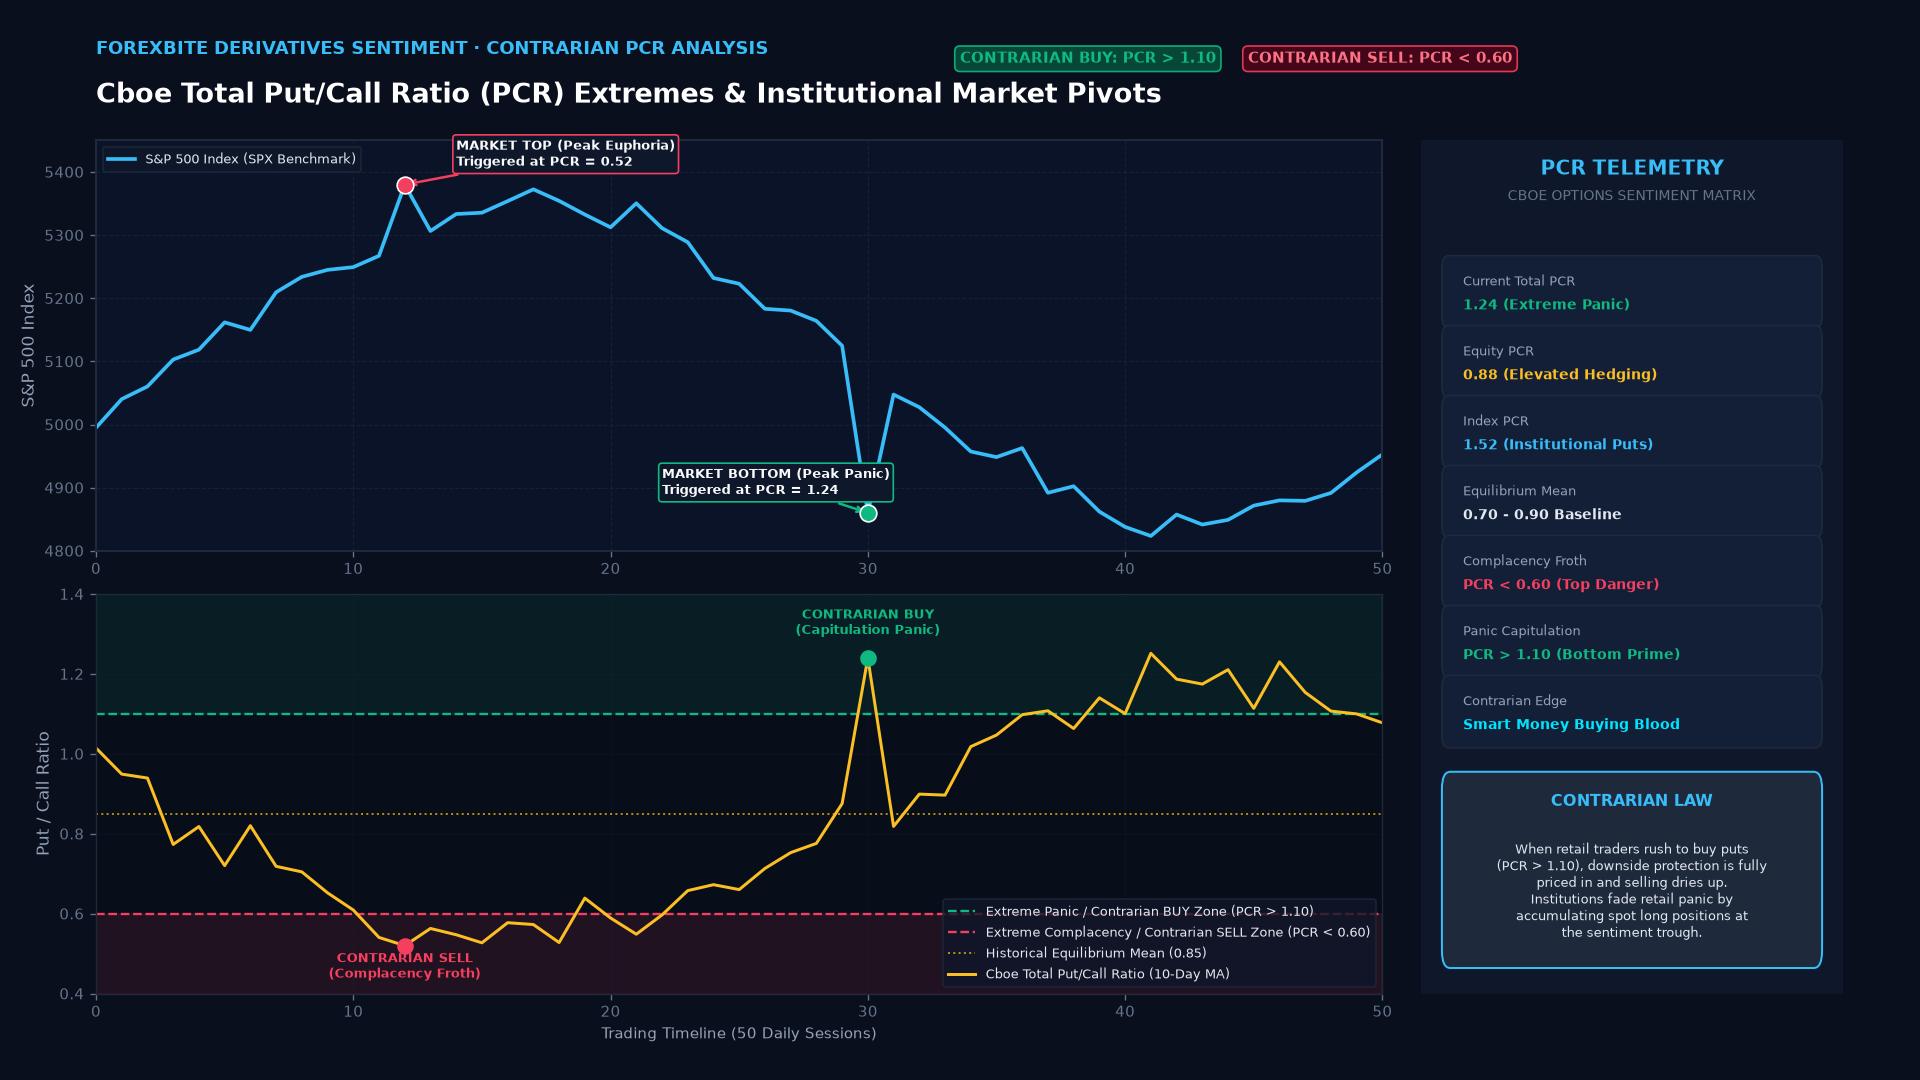 Figure: Cboe Total Put/Call Ratio (PCR) sentiment extremes against S&P 500 price action, highlighting contrarian market bottom buy signals (PCR > 1.10) and top sell signals (PCR < 0.60).
The Three Primary Cboe Put/Call Ratios
The Chicago Board Options Exchange (Cboe)—the world’s largest options exchange—calculates and publishes three distinct daily versions of the Put/Call Ratio, each catering to different analytical objectives:
1. The Equity Put/Call Ratio
Tracks trading activity exclusively on individual single-stock options (e.g., Apple, Tesla, Nvidia). Because retail traders and speculative hedge funds dominate single-equity options, the Equity PCR is the purest measure of direct investor optimism and speculative froth. Its baseline average is lower (~0.55 to 0.65) because investors inherently hold a long-term bullish bias toward stocks.
2. The Index Put/Call Ratio
Tracks options on broad market indices—predominantly the S&P 500 Index (SPX) and Nasdaq-100 (NDX). Because large institutional pension funds and asset managers utilize index options to buy portfolio insurance (protective puts), the Index PCR normally trades at much higher baseline levels (typically 1.10 to 1.40).
3. The Total Put/Call Ratio
Combines all equity, index, and exchange-traded fund (ETF) options traded on the Cboe into a single aggregate metric. It serves as the primary macro sentiment barometer for broad financial markets.
Contrarian Interpretation: Trading Market Extremes
While novice traders often assume that a high Put/Call Ratio is a bearish signal, professional technicians interpret the PCR through a contrarian framework:
| PCR Metric State | Raw Market Behavior | Contrarian Institutional Interpretation | Actionable Strategy |
|---|---|---|---|
| Spike Above 1.20–1.40 (Equity/Total PCR) | Investors are panic-buying puts to hedge against further downside. | Extreme Bearish Capitulation: Everyone who wanted to sell has already hedged or sold out. Downside selling power is exhausted. | Contrarian Buy Setup: Prepare for a sharp mean-reversion rally or market bottom. |
| Dip Below 0.50–0.60 (Equity/Total PCR) | Speculators are aggressively buying calls; put buying completely collapses. | Extreme Bullish Complacency: Euphoria and greed dominate. No one is hedged against downside risk. Market is fragile to negative catalysts. | Contrarian Sell / Hedge Setup: Tighten stop-losses, take profits, or buy cheap downside protection. |
| Mid-Range (0.70 to 0.85) | Balanced flow between calls and puts. | Equilibrium Regime: Options flow reflects healthy market participation. | Trade in alignment with established technical trends. |
       CONTRARIAN REVERSAL MECHANICS: PCR SPIKES

  Market Plummets ---> Panic Buying of Puts ---> PCR Spikes to 1.35 (Extreme)
                                                          |
  Smart Money Steps In <--- Retail & Funds Fully Hedged --+
                                                          |
  Short Squeeze / Relief Rally Triggered ---> Market Bottom Formed
Quantitative Smoothing: The 10-Day Moving Average
Because daily raw Put/Call Ratio prints fluctuate erratically due to institutional block trades or quarterly options expiration cycles, quantitative desks apply a 10-day or 21-day Simple Moving Average (SMA):
$$\text{Smoothed PCR} = \frac{1}{10} \sum_{i=1}^{10} \text{Daily PCR}_i$$
When the 10-day moving average of the Equity Put/Call Ratio reaches multi-standard-deviation bands (e.g., crossing above 0.85 or falling below 0.50), the signal reliability for cyclical market turning points increases exponentially.
Real-World Case Study: The October 2022 Market Bottom
Throughout 2022, surging inflation and rapid Federal Reserve rate hikes drove the S&P 500 into a severe bear market, down 25% by early autumn.
- The Panic Milestone: In mid-October 2022, as the headline US CPI print hit 8.2%, market panic reached a fever pitch.
- The PCR Indicator: The Cboe Total Put/Call Ratio skyrocketed past 1.45, and the single-day Equity PCR breached 1.15—a statistical 3-standard-deviation extreme that had occurred only three times in the prior two decades.
- The Contrarian Signal: Options market participants had bought an unprecedented volume of downside put contracts, signaling peak market fear and total hedge exhaustion.
- The Market Turning Point: On October 13, 2022, despite the grim CPI inflation headline, the market staged a monumental intraday reversal. The S&P 500 bottomed at 3,491 and embarked on an epic bull market that carried equities to all-time highs above 5,000 over the subsequent 18 months.
Frequently Asked Questions
Can the Put/Call Ratio be applied to foreign exchange trading?
Yes. While the standard Cboe PCR tracks equities and indices, institutional currency analysts calculate the FX Put/Call Ratio using currency options traded on the Chicago Mercantile Exchange (CME) or interbank OTC risk reversal volatility surfaces (which measure the premium difference between OTM calls and OTM puts).
Why is the Equity Put/Call Ratio normally below 1.0?
The Equity Put/Call Ratio typically averages around 0.65 because the equity market possesses a long-term upward structural drift. Retail and institutional investors inherently buy more long call options for leverage than long put options for speculation.
What is the difference between volume-based and open-interest-based PCR?
- Volume PCR: Measures options traded during a single daily session, reflecting immediate, fast-moving sentiment shifts and breaking news reactions.
- Open Interest PCR: Measures the total outstanding open contracts across the entire options chain, reflecting longer-term institutional hedging posture and multi-week positioning.
Ready to trade forex?
Open a free demo account with a regulated broker. Practice with virtual funds before risking real money.