Three Types of Forex Analysis: Technical, Fundamental, and Sentiment
Successful forex trading combines three analytical frameworks. Learn what technical analysis, fundamental analysis, and market sentiment each measure — and how to use them together.
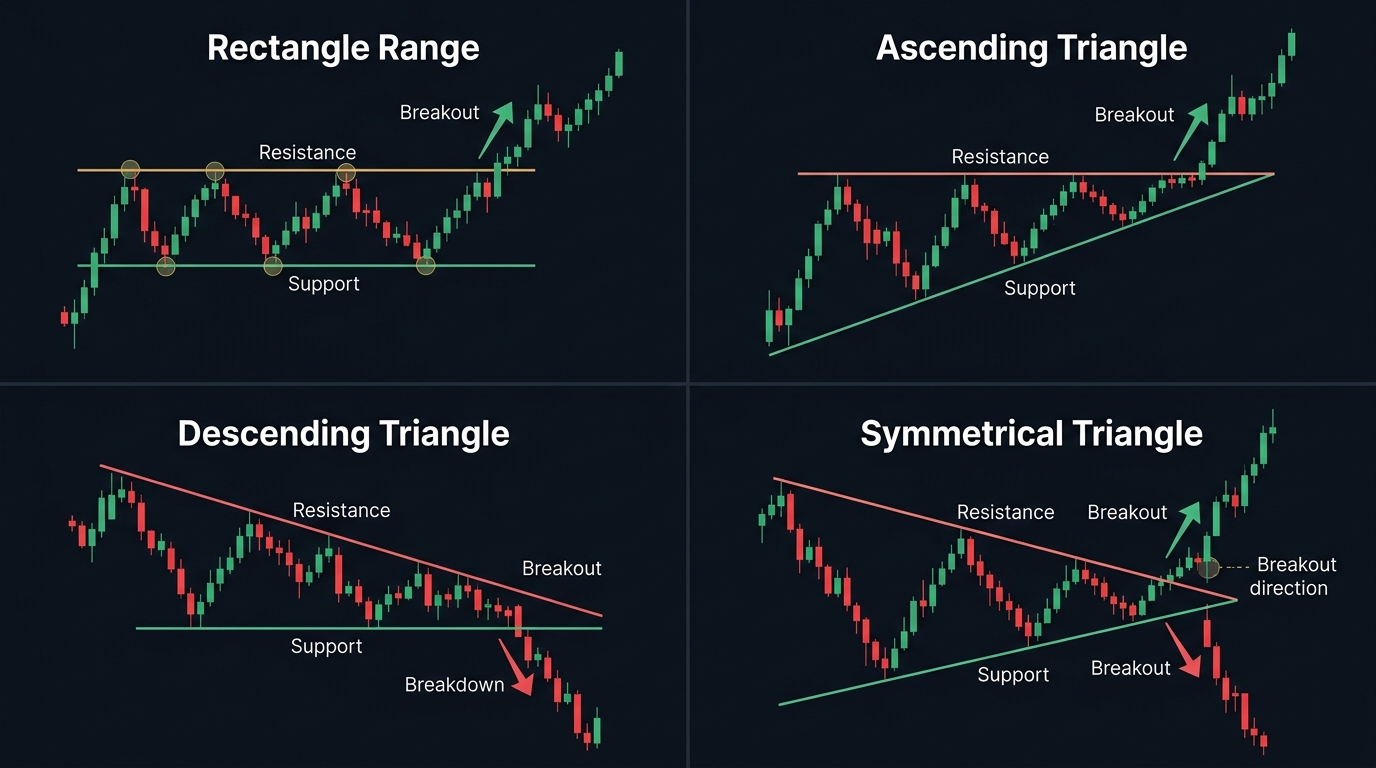
There are three ways to analyze the forex market, and experienced traders use all three — though they weight them differently depending on their strategy and timeframe. Understanding what each approach measures (and where it breaks down) is the foundation of building a coherent trading methodology.
The three pillars are: technical analysis, fundamental analysis, and sentiment analysis. None of them is sufficient on its own. Together, they give you a multi-dimensional picture of where price is likely to move next.
Technical Analysis: Price Contains Everything
Technical analysis operates on a core assumption: all available information about a currency is already reflected in its price. Economic news, central bank decisions, geopolitical events — traders have collectively processed all of it, and the result is the current price. If that’s true, then studying price itself — how it moves, patterns it forms, and momentum it carries — is sufficient to make trading decisions.
What technical analysts study:
- Price charts — visual representations of price movement over time. The most widely used in forex is the candlestick chart, where each candle shows the open, high, low, and close for a defined time period.
- Support and resistance levels — price zones where buying or selling has historically been concentrated. These levels often repeat because market participants remember them.
- Trends — the directional bias of price movement over a period. A series of higher highs and higher lows defines an uptrend; lower highs and lower lows define a downtrend.
- Chart patterns — recurring formations like head and shoulders, triangles, flags, and double tops that suggest probable next moves.
- Technical indicators — mathematical calculations applied to price data. Moving averages, RSI, MACD, Bollinger Bands, and dozens of others help traders identify trend direction, momentum, and overbought/oversold conditions.
Where technical analysis works best: Short to medium timeframes where price patterns repeat reliably. Day traders and swing traders use TA as their primary framework because on a 15-minute or 4-hour chart, the underlying economics matter less than where price is and how momentum is developing.
Where it breaks down: Technical analysis doesn’t warn you that a central bank is about to surprise the market with an unexpected rate decision. A perfect technical setup can be blown apart in seconds by a fundamental shock. This is why traders who rely purely on technical analysis still need awareness of the economic calendar.
Fundamental Analysis: What Drives Currency Value Long-Term
Fundamental analysis asks: what is this currency actually worth, based on the economic conditions of the country that issues it? It examines the underlying economic forces — interest rates, inflation, growth, employment, trade balances — that determine a currency’s intrinsic value over weeks, months, and years.
The most important fundamental drivers:
Interest rates are the single most powerful long-term driver of currency value. When a central bank raises interest rates, investors around the world move capital into that country’s bonds to capture higher yields. This creates demand for the currency. When the US Federal Reserve signals rate hikes, the dollar typically strengthens. When it signals cuts, the dollar weakens.
Inflation interacts with interest rates in a feedback loop. High inflation erodes a currency’s purchasing power but often prompts central banks to raise rates to control it — which supports the currency. The relationship is nuanced and context-dependent.
Economic growth (GDP) signals whether an economy is expanding or contracting. Stronger growth tends to attract investment, supporting the currency. Weak or negative growth does the opposite.
Employment data — particularly the US Non-Farm Payrolls report released monthly — is one of the most market-moving pieces of data in forex. Strong employment signals economic health and often precedes rate hikes.
Where fundamental analysis works best: Longer timeframes. A currency pair’s direction over weeks and months is primarily driven by fundamentals. Traders who hold positions for days or weeks — swing traders and position traders — integrate fundamental analysis heavily.
Where it breaks down: Markets don’t always move logically in response to fundamentals. Sometimes “buy the rumor, sell the news” means a currency falls even when data is strong because traders had already positioned for strength. Fundamental analysis explains why markets move; it’s less reliable for predicting when or by how much.
Sentiment Analysis: Reading the Crowd
Sentiment analysis is harder to quantify than the other two, which is partly why it’s underused by beginners. It asks: what does the majority of the market currently believe about this currency, and is that belief likely to persist or reverse?
Markets are networks of human beings making decisions under uncertainty. Fear, greed, and confidence shape price action in ways that can’t be captured by GDP figures or chart patterns alone. When sentiment reaches an extreme — when virtually everyone is bullish on a currency — the conditions for a reversal are often strongest because there’s nobody left to buy.
Tools for measuring sentiment:
Commitment of Traders (COT) report — published weekly by the US Commodity Futures Trading Commission (CFTC). It shows the net positions of large institutional traders (commercial hedgers vs. speculative funds) in currency futures. When speculative funds are at extreme net-long or net-short positions, it often signals a potential reversal.
Retail positioning data — some brokers publish what percentage of their retail clients are long vs. short on major pairs. Because retail traders tend to be systematically wrong at extremes (they’re often buying bottoms that haven’t formed yet), extreme retail positioning can function as a contrarian indicator.
Market news and narrative — what story is driving the market right now? Is it all about the Fed? About geopolitical risk? About a specific currency crisis? The dominant narrative shapes how market participants interpret incoming data. When USD/JPY moves on a day with no relevant data releases, sentiment and positioning shifts are often responsible.
Where sentiment works best: Identifying turning points and extreme positioning. It’s most valuable when combined with technical confluence (a pattern forming at a major support level) and fundamental context (the reason for the sentiment shift).
How the Three Work Together in Practice
The most reliable trading setups align all three frameworks. Here’s an example:
A trader is watching EUR/USD. The fundamental picture suggests the ECB is done hiking rates while the Fed may hike once more — bearish for EUR. Technically, price has bounced to a well-defined resistance zone and is forming a bearish engulfing candlestick pattern. The COT report shows speculative funds at their highest net-long EUR position in 18 months — sentiment at an extreme.
That’s three frameworks pointing in the same direction. The probability of a meaningful short is higher than any one of those signals alone would suggest.
This alignment doesn’t happen every day, which is fine. Patience and selectivity are assets in trading. Waiting for setups where the fundamentals, technicals, and sentiment all agree — rather than trading on any single indicator — is what separates disciplined traders from impulsive ones.
Next: Fundamental Analysis in Detail: How Economic Data Moves Currencies
Previous: Forex Market Hours
Related lessons: Support and Resistance Levels | Interest Rates and Currency Value
Related dictionary terms: Technical Analysis | Fundamental Analysis | Market Sentiment | COT Report

Ready to Practice This Strategy?
Test what you learned on a free, risk-free demo account before risking real money.