Advance-Decline Line
The Advance-Decline Line (A/D Line) is a cumulative market breadth indicator that measures the net difference between the number of advancing and declining securities each day. It reveals the underlying participation and internal health of a financial market beneath headline index levels.
What Is the Advance-Decline Line?
The Advance-Decline Line (commonly abbreviated as the A/D Line) is one of the oldest and most respected market breadth indicators in technical analysis. Originally developed for stock exchange analysis, it measures market participation—the number of individual assets actively participating in a trend—rather than just the price movement of a weighted index.
Headline indices like the S&P 500, the NASDAQ 100, or the FTSE 100 are capitalization-weighted. In a cap-weighted benchmark, a handful of mega-cap corporate giants exert an outsized influence on the index’s calculated value. If five trillion-dollar technology conglomerates rally aggressively, they can push the overall index to record highs even while hundreds of mid-sized and smaller companies quietly suffer severe declines.
The A/D Line strips away capitalization weighting by treating every listed asset equally. A one-dollar advance in a small-cap firm carries the exact same mathematical weight as a one-dollar advance in the world’s largest corporation. By tracking whether the majority of stocks are rising or falling, the A/D Line tells analysts whether a rally is backed by broad institutional buying or driven by narrow, fragile leadership.
How the A/D Line Is Calculated
The calculation of the Advance-Decline Line is cumulative and remarkably simple:
- Calculate Net Advances for the Period: $$ \text{Net Advances} = \text{Number of Advancing Stocks} - \text{Number of Declining Stocks} $$
- Add Net Advances to the Previous Value: $$ \text{A/D Line}{\text{Today}} = \text{A/D Line}{\text{Yesterday}} + \text{Net Advances}_{\text{Today}} $$
Unchanged securities are excluded from the equation. Because the indicator is cumulative, the absolute numerical value of the A/D Line is arbitrary—what matters is the direction, slope, and structural peaks and valleys of the indicator line relative to the price chart.
Interpreting A/D Line Signals: Confirmation vs. Divergence
The true analytical power of the Advance-Decline Line lies in comparing its trajectory against the benchmark index:
1. Trend Confirmation
In a healthy, sustainable bull market, both the headline index and the A/D Line advance in tandem, setting higher highs and higher lows. This indicates broad market participation across multiple sectors, signaling that institutional liquidity is flowing widely throughout the economic system.
2. Bearish Divergence (The Warning Sign)
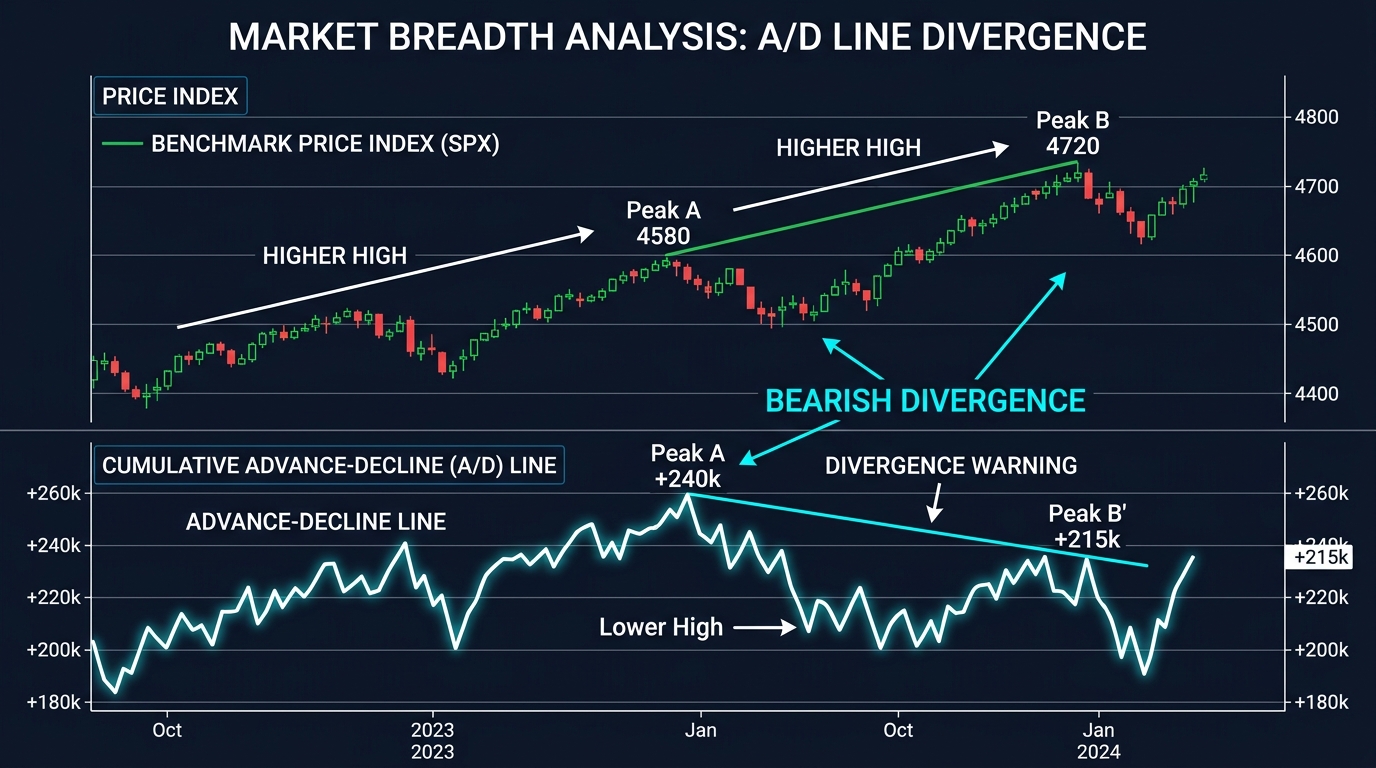
A bearish divergence occurs when the headline index pushes upward to register a new cycle or all-time high, but the A/D Line fails to confirm, forming a distinct lower high. This divergence reveals internal decay: fewer and fewer companies are participating in the rally, and the index is being propped up exclusively by a narrowing group of mega-caps. Bearish divergences on the A/D Line frequently precede major equity market corrections and cyclical bear markets by several weeks or months.
3. Bullish Divergence (The Reversal Signal)
Conversely, when an index plunges to a new low, but the A/D Line registers a higher trough, a bullish divergence forms. This signals that selling pressure has dried up across the broad market, and institutional accumulation is underway beneath the surface, foreshadowing a powerful upside reversal.
The A/D Line’s Vital Connection to Forex Markets
While the Advance-Decline Line is computed from equity exchange data (such as the New York Stock Exchange), foreign exchange traders monitor breadth closely for critical macro insights:
Global Risk Appetite (“Risk-On / Risk-Off”)
Global currency flows are deeply intertwined with equity market sentiment. High-beta commodity currencies (such as the Australian Dollar, New Zealand Dollar, and Canadian Dollar) thrive during periods of genuine risk expansion. When the S&P 500 reaches new highs accompanied by a rising A/D Line, forex traders can confidently enter long positions in risk-correlated currencies.
However, if an equity index grinds higher while the A/D Line deteriorates, experienced FX traders recognize a “stealth risk-off” regime. They avoid buying high-beta currencies and begin building defensive long positions in safe-haven assets—specifically the US Dollar (USD), Swiss Franc (CHF), and Japanese Yen (JPY)—in anticipation of an impending market unwind.
Currency Market Breadth
Macro desks also apply the mathematical concept of advance-decline breadth directly to currency universes. By calculating how many global currencies are advancing versus declining against the US Dollar across a 30-currency basket, analysts gauge whether dollar strength is a universal macroeconomic phenomenon driven by Federal Reserve policy, or merely an isolated move against a single troubled currency like the Euro or British Pound.
Practical Market Example
Consider a historic market juncture:
- On Month 1, the S&P 500 trades at 4,800, and the NYSE A/D Line sits at a reading of +12,500. Market internals show 2,100 advancing stocks and 900 decliners.
- Two months later, the index climbs to 5,000 (+4.1% gain). Media outlets celebrate new all-time highs.
- However, during this two-month rally, daily breadth was consistently negative: on average, 1,200 stocks advanced while 1,800 declined. The A/D Line dropped to +10,800, establishing a severe bearish divergence.
- An equity trader looking only at the index sees strong momentum. A macro currency trader examining the A/D Line recognizes extreme fragility: only four mega-cap technology stocks are driving the index higher.
- In response, the forex trader shorts AUD/JPY at 96.50 and closes long positions in emerging market currencies.
- Three weeks later, the mega-caps stall, the equity market enters a sharp 8% correction, and AUD/JPY collapses 350 pips to 93.00, validating the warning signaled weeks earlier by the A/D Line.
Key Takeaways
- The Advance-Decline Line is a cumulative breadth indicator calculated by subtracting declining securities from advancing securities.
- It provides an unweighted picture of market participation, cutting through capitalization distortions in major indices.
- A healthy rally requires confirmation: the A/D Line should make new highs alongside the price index.
- A bearish divergence (index higher, A/D Line lower) is one of the most reliable early warnings of an approaching market top.
- Forex traders utilize equity market breadth to gauge the authenticity of global “risk-on” sentiment and anticipate safe-haven currency surges.
FAQ
Can the Advance-Decline Line be applied directly to forex pairs? Because the spot forex market is decentralized without a central exchange reporting daily advancing versus declining issues, you cannot compute a classic A/D Line for a single currency pair. However, analysts construct synthetic currency breadth indices by tracking the percentage of currency pairs within a predefined basket trading above their 20-day or 50-day moving averages.
What is the difference between the A/D Line and the McClellan Oscillator? The Advance-Decline Line is a cumulative running total of net advances. The McClellan Oscillator is a momentum oscillator calculated from the difference between two exponential moving averages (typically 19-day and 39-day EMAs) of daily net advances, designed to identify short-term overbought and oversold conditions.
Why does the A/D Line often lead price? Smart money institutional distribution begins subtly. Large funds reduce exposure to hundreds of peripheral, vulnerable companies long before they liquidate their core holdings in the market’s most liquid mega-cap leaders. The A/D Line captures this quiet institutional selling while headline indices still look strong.
Ready to trade forex?
Open a free demo account with a regulated broker. Practice with virtual funds before risking real money.