Andrews Pitchfork
Andrews' Pitchfork is a technical analysis charting tool developed by Dr. Alan Andrews that uses three consecutive swing pivots to project a central median line flanked by two equidistant parallel lines. It serves as a dynamic channel to forecast support, resistance, and price targets.
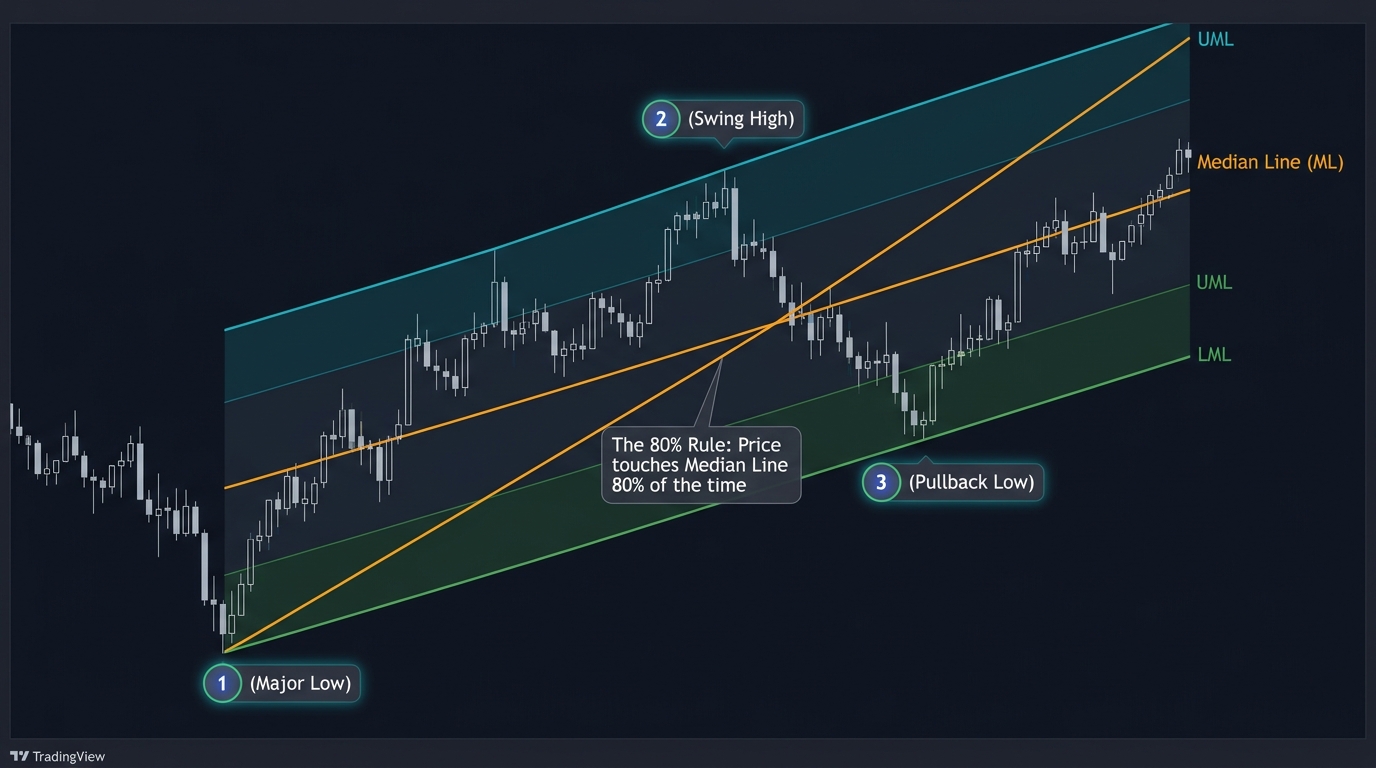
What Is Andrews’ Pitchfork?
Andrews’ Pitchfork is an advanced geometric charting methodology developed by educator and market analyst Dr. Alan H. Andrews during the mid-20th century. Based originally on the “Action-Reaction Principle” pioneered by statistician Roger Babson (who famously applied Isaac Newton’s third law of motion to financial markets), Andrews refined the concept into what he termed the Median Line Study.
The tool derives its name from its visual resemblance to a three-pronged pitchfork. By anchoring three pivotal price points on a chart—typically a major swing low followed by a swing high and a subsequent higher low, or vice versa—the tool generates three parallel trend lines that extend into future price action:
- A central Median Line that defines the primary trajectory and equilibrium of the trend.
- An Upper Parallel Line that acts as dynamic resistance.
- A Lower Parallel Line that acts as dynamic support.
Unlike static horizontal support and resistance lines, Andrews’ Pitchfork accounts for both price and time simultaneously, offering dynamic boundary levels that adapt continuously as the market advances.
Constructing the Pitchfork: The Three Anchor Points
Proper application of the pitchfork requires identifying three distinct, alternating swing points on the chart:
- Point 1 (Pivot A): The originating pivot that marks the start of the trend. In an emerging uptrend, this is the major swing low where the prior decline concluded.
- Point 2 (Pivot B): The first prominent reaction peak. In an uptrend, this is the first swing high made after the reversal from Point 1.
- Point 3 (Pivot C): The corrective pullback trough. In an uptrend, this is the higher swing low established as buyers step back in after the pullback from Point 2.
The Mathematical Geometry
Once these three anchors are selected:
- The charting software calculates the exact mathematical midpoint between Point 2 and Point 3.
- The Median Line (ML) is drawn originating from Point 1 and passing straight through that calculated midpoint, extended forward indefinitely.
- The Upper Median Line (UML) is drawn parallel to the median line, originating directly from Point 2.
- The Lower Median Line (LML) is drawn parallel to the median line, originating directly from Point 3.
Because the upper and lower lines are equidistant from the central median line, they establish a symmetrical channel governed by the initial momentum of the move.
Andrews’ Core Market Principles
Dr. Andrews taught five fundamental observations regarding median line behavior, which form the bedrock of pitchfork trading:
1. The 80% Rule
Andrews stated that once a valid three-point pitchfork is established, price will gravitate toward and reach the median line approximately 80% of the time. The median line acts as a statistical center of gravity; price is continuously pulled toward it before overshooting toward the outer bounds.
2. Oscillation and Reversal
Price frequently makes a swing pivot or reverses directly upon touching the median line. Traders use this touch as a primary profit-taking target for positions entered at the outer boundary lines.
3. Multiple Fluctuation Cycles
In strong, healthy trends, price oscillates back and forth between the median line and one of the outer parallel lines multiple times before the structural integrity of the pitchfork breaks down.
4. The Failure Rule (The Most Powerful Signal)
If price approaches the median line but fails to reach it, reversing prematurely, it reveals a profound shift in market momentum. A failure to reach the median line in an uptrend warns that buying pressure is exhausted and strongly presages an explosive breakdown below the lower parallel line.
5. Role Reversal Beyond Boundaries
When price decisively penetrates the upper or lower parallel line, the broken line flips its polarity. A broken upper line becomes dynamic support on subsequent pullbacks, while a broken lower line becomes new dynamic resistance.
Popular Pitchfork Modifications
Market conditions do not always conform to standard pitchfork slopes. Analysts frequently deploy two common variations:
- The Schiff Pitchfork: In shallow, drifting markets or prolonged consolidations, the standard pitchfork can project an excessively steep median line that price cannot maintain. The Schiff modification shifts the origin of Point 1 halfway along the vertical distance between Point 1 and Point 2. This flattens the angle of the pitchfork, creating a channel better suited for grinding trends.
- The Modified Schiff Pitchfork: This variation shifts Point 1 to the exact midpoint of both the price and time distance between Point 1 and Point 2. It offers an even more conservative slope, favored on higher-timeframe daily and weekly forex charts.
A Practical Trading Strategy
Consider an uptrend forming on the 4-Hour chart of EUR/USD:
- Setup: EUR/USD hits a multi-week low at 1.0700 (Point 1), rallies to 1.0850 (Point 2), and pulls back to find support at 1.0760 (Point 3). The trader anchors Andrews’ Pitchfork across these three coordinates.
- Confirmation: The pitchfork projects an upward-sloping median line targeting 1.0920, with the lower parallel line offering dynamic support at 1.0780.
- Entry: Price tests the lower parallel line at 1.0785, printing a bullish hammer candlestick pattern. The trader enters a long position on the candle close.
- Stop-Loss: Placed 20 pips below the lower parallel line at 1.0760, risking 25 pips.
- Exit Targets:
- Target 1 (Partial scale-out): The central median line at 1.0880 (capturing +95 pips).
- Target 2 (Runner): The upper parallel line near 1.0960, adjusting the stop-loss to breakeven once Target 1 is achieved.
Key Takeaways
- Andrews’ Pitchfork uses three consecutive price pivots to project a dynamic median line and two outer support and resistance channels.
- The tool is grounded in Roger Babson’s Action-Reaction principle and the physics of equilibrium.
- Price reaches the central median line in roughly 80% of confirmed pitchfork formations.
- A failure of price to reach the median line is a high-conviction warning of an impending trend reversal.
- The Schiff and Modified Schiff variations adjust the origin point to handle shallow or consolidating trends without creating an overly steep slope.
FAQ
How do I know if I picked the right three anchor points? A pitchfork is valid if future price action visibly respects the lines. If price repeatedly bounces off the lower parallel line and reacts to the central median line, your anchor points reflect real market structure. If price cuts through the lines haphazardly without pausing, the chosen pivots were insignificant noise.
Can Andrews’ Pitchfork be used on any timeframe? Yes. Pitchfork geometry is fractal and works on 5-minute intraday charts as well as weekly macro charts. However, higher timeframes (such as the 4-Hour, Daily, and Weekly) produce far more reliable reactions because the anchor points represent major institutional liquidity pools.
What should I do when price breaks out of the pitchfork? A clean close outside the pitchfork signals that the trend channel has expired. Do not force an old pitchfork onto new price action. Instead, wait for a new swing high and low to form, then construct a fresh pitchfork aligned with the new market phase.
Ready to trade forex?
Open a free demo account with a regulated broker. Practice with virtual funds before risking real money.