Breakout
A breakout occurs when price moves decisively beyond a defined support, resistance, trend line, or chart pattern boundary. It signals that the balance of buying and selling pressure has shifted — supply or demand that previously contained price has been overcome. Breakouts are among the most widely traded signals in forex technical analysis, offering clear entry signals with defined risk.
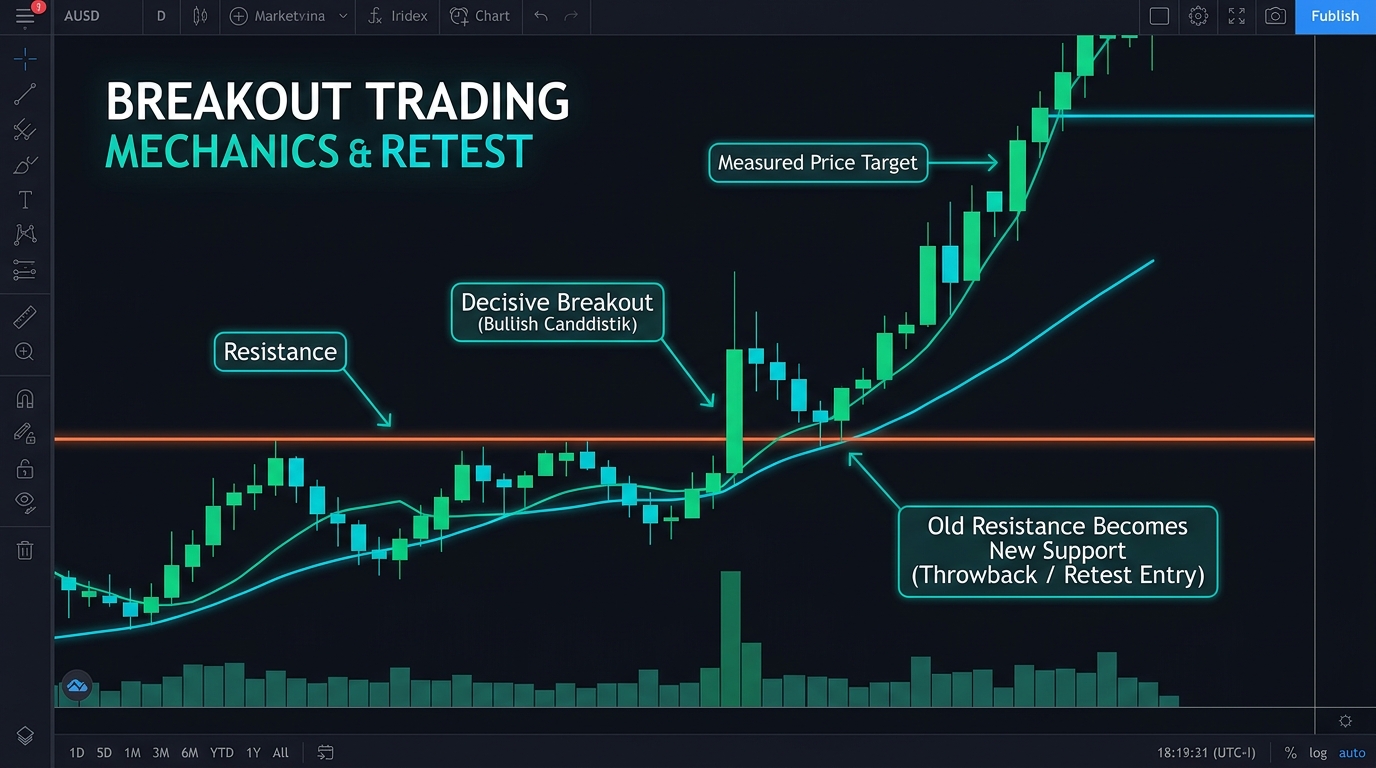
The Logic of Breakouts
Support and resistance levels represent areas where the market has consistently failed to move beyond. The more times a level has been tested without breaking, the more significant it becomes — and the more explosive the eventual breakout tends to be.
The logic is supply and demand: at a resistance level, sellers who’ve been waiting at that price continuously absorb buying pressure. Each time buyers push to the level, sellers supply enough volume to stop the advance. Eventually, one of two things happens: buying pressure builds to the point where it overwhelms the seller supply, or sellers become exhausted from repeatedly defending the level. Either way, when the level finally gives, there are suddenly no sellers at a price that previously had many — and price can move rapidly to the next resistance cluster.
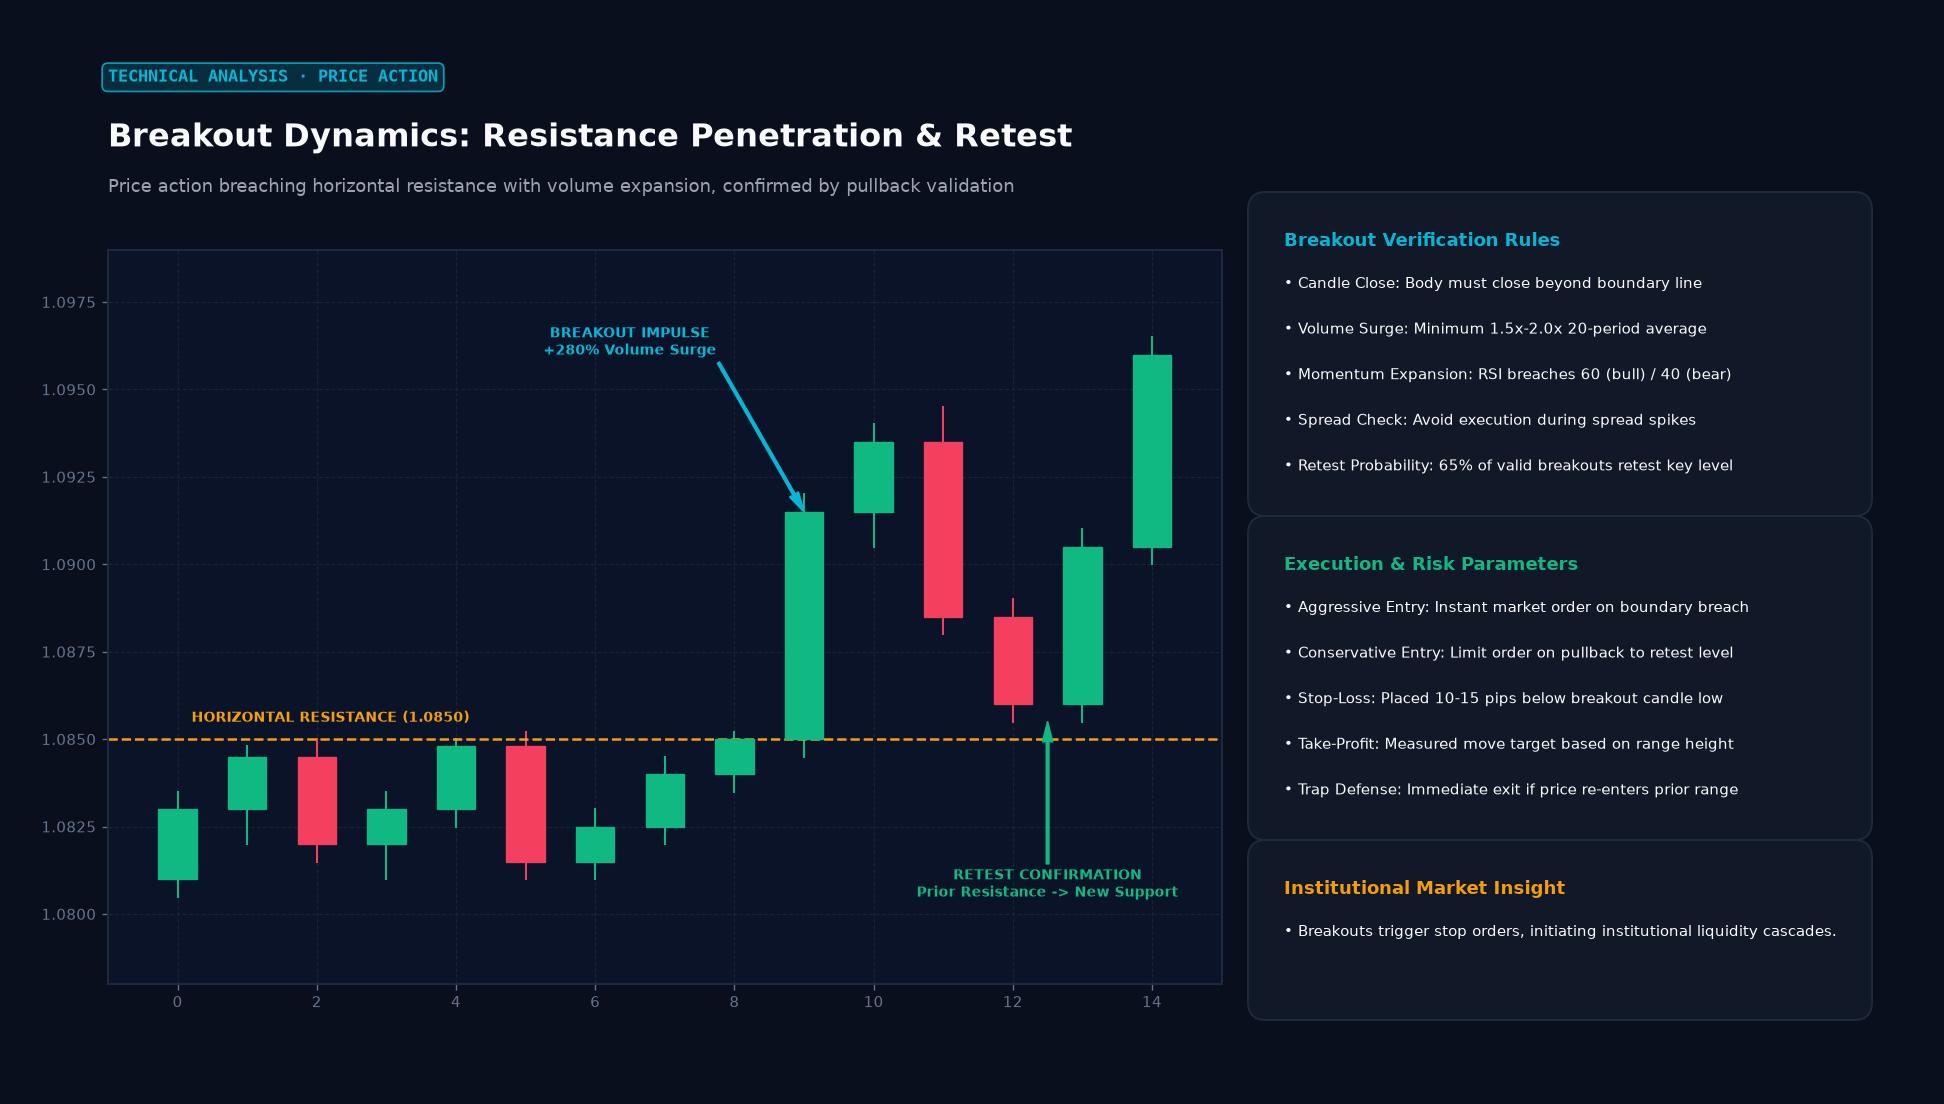 Figure: Price action breaching horizontal resistance with volume expansion, confirmed by pullback validation
Types of Breakouts
Resistance breakout (bullish): Price closes above a defined resistance level. Old resistance becomes new support. Targets: next resistance level above, or a measured move projection.
Support breakdown (bearish): Price closes below a defined support level. Old support becomes new resistance. Targets: next support level below.
Trend line breakout: Price closes beyond an established ascending or descending trend line — can signal either reversal (break against the trend) or acceleration (break in the trend direction).
Chart pattern completion: When price breaks out of a recognized pattern (triangle, flag, head and shoulders neckline, wedge boundary), the pattern is “completed” — the breakout is the entry signal.
Confirming a Genuine Breakout
Not all price moves beyond a level are genuine breakouts. The forex market frequently produces “false breakouts” — price temporarily pierces a level, triggers stops, then reverses. Confirmation reduces (but doesn’t eliminate) false breakout risk:
Candle close: The single most important confirmation. A breakout on the close of the candle rather than just an intraday wick is significantly more reliable. A daily candle closing above resistance carries much more weight than a 5-minute candle wick peeking above it.
Volume expansion: In forex, tick volume expansion on the breakout candle confirms broader participation. Low-volume breakouts are more likely to be false.
The second candle: The candle following the breakout candle should maintain or extend the breakout, not immediately reverse below the level. A second candle confirming the new territory reduces false breakout probability.
Context with higher timeframe: A breakout that aligns with the direction of the trend on a higher timeframe is more reliable than one that’s counter-trend.
The False Breakout (Fakeout)
A false breakout — often called a “fakeout” or “stop hunt” — occurs when price breaks through a level, triggering stop-losses and breakout entries, then immediately reverses. Institutional traders are often accused of engineering these moves to create liquidity: by pushing price through a well-known stop-loss cluster, they fill their own large orders against the retail flow before reversing.
Whether intentional or simply a consequence of order clustering at key levels, false breakouts are common. The practical defense: wait for candle close confirmation before entering, and accept that some genuine breakouts will be missed while reducing exposure to fakeouts.
Breakout Trading Strategies
Aggressive entry: Enter at the close of the breakout candle with a stop below the breakout level. Higher risk (no retest confirmation) but captures more of the move.
Conservative entry (retest): Wait for price to break, pull back to test the broken level (old resistance now support), and confirm it holds. Enter on the retest with a stop below the confirmed new support. Lower risk (confirmed role reversal) but misses trades when price doesn’t retest.
Measured move target: For most chart pattern breakouts, the target is the height of the pattern applied to the breakout level. For raw support/resistance breaks, the next structural level becomes the target.
Key Takeaways
- Breakouts occur when price closes beyond a defined support/resistance or pattern boundary
- Candle close confirmation is the most critical breakout validity test
- False breakouts (fakeouts) are common — require confirmation before entering
- Two entry approaches: aggressive (on the breakout) or conservative (on the retest)
- Target: next structural level or measured move projection
FAQ
How do I avoid false breakouts? Require candle close confirmation (not intraday wicks), look for volume confirmation, verify the breakout aligns with the higher-timeframe trend, and require the first post-breakout candle to confirm rather than immediately reverse. Accepting you’ll miss some genuine breakouts is the trade-off for reducing false breakout entries.
Are breakouts more reliable at specific times of day? Yes. Breakouts during the London-New York overlap (13:00-17:00 GMT) carry more weight because of the highest liquidity. Breakouts during low-volume Asian hours on major European pairs are more prone to being false — there isn’t enough institutional participation to sustain the move.
Ready to trade forex?
Open a free demo account with a regulated broker. Practice with virtual funds before risking real money.