Descending Triangles
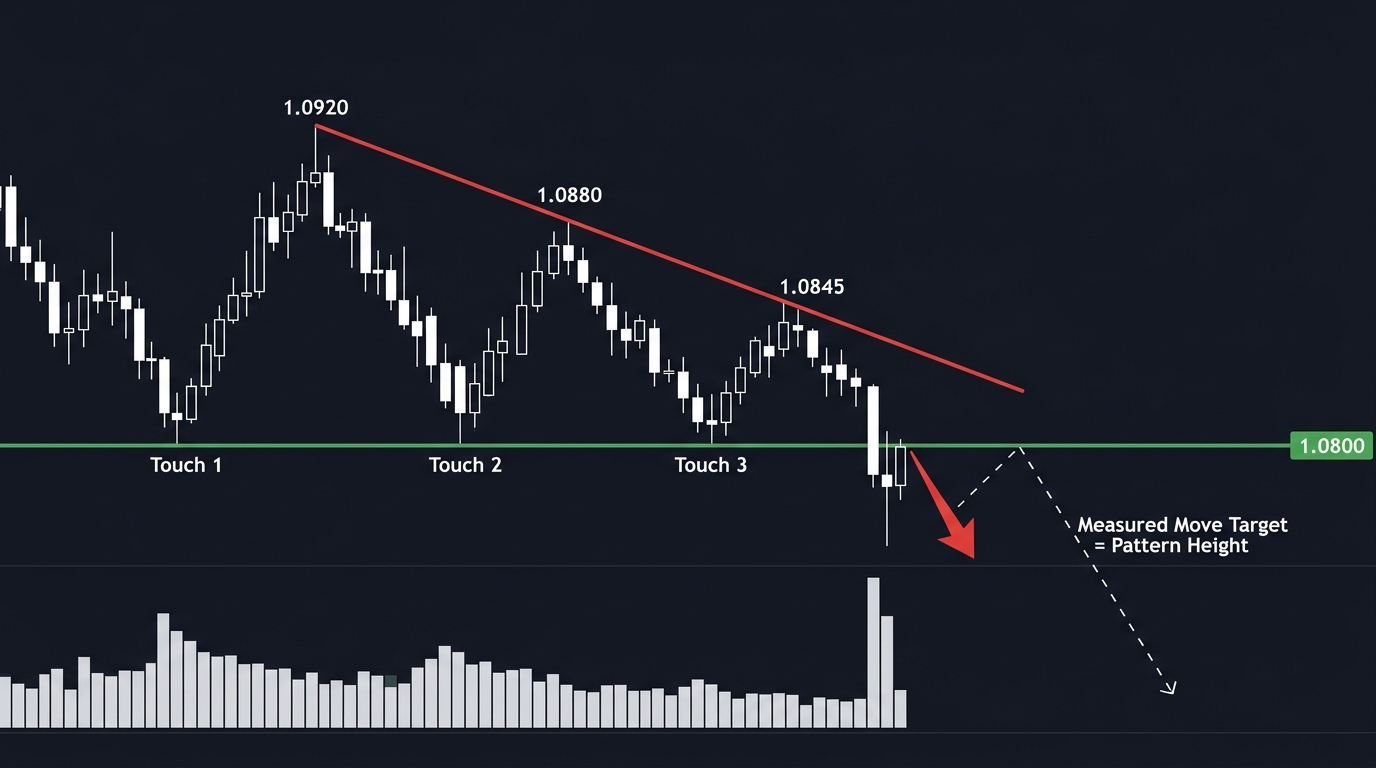
A descending triangle is a bearish technical chart pattern defined by a flat horizontal support level at the bottom and a descending upper trend line connecting lower swing highs. It reflects persistent selling pressure steadily eroding buyer support, typically culminating in a downward breakout.
What Is a Descending Triangle?
In technical analysis and chart pattern recognition, the descending triangle is a prominent, high-probability consolidation pattern. It belongs to the triangle family (alongside ascending triangles and symmetrical triangles) and is traditionally classified as a bearish continuation pattern.
The pattern reflects a clear psychological struggle between two opposing market forces:
- The Buyers (The Floor): A determined group of buyers, commercial institutions, or algorithmic limit orders repeatedly steps in at a specific, fixed price level, establishing a rigid horizontal support line.
- The Sellers (The Squeeze): Sellers demonstrate increasing aggression with every passing cycle. Rather than waiting for price to rally back to previous swing highs, bears sell earlier and at progressively lower prices, generating a descending upper resistance trend line formed by a series of Lower Highs (LH).
As the horizontal support floor and the downward-sloping resistance line converge toward the pattern’s apex, the trading range compresses. The repeated testing of the support level gradually exhausts available buy limit orders, ultimately leading to an explosive downside breakdown.
Pattern Anatomy and Structural Rules
To identify a valid descending triangle on a forex chart, analysts look for five distinct structural components:
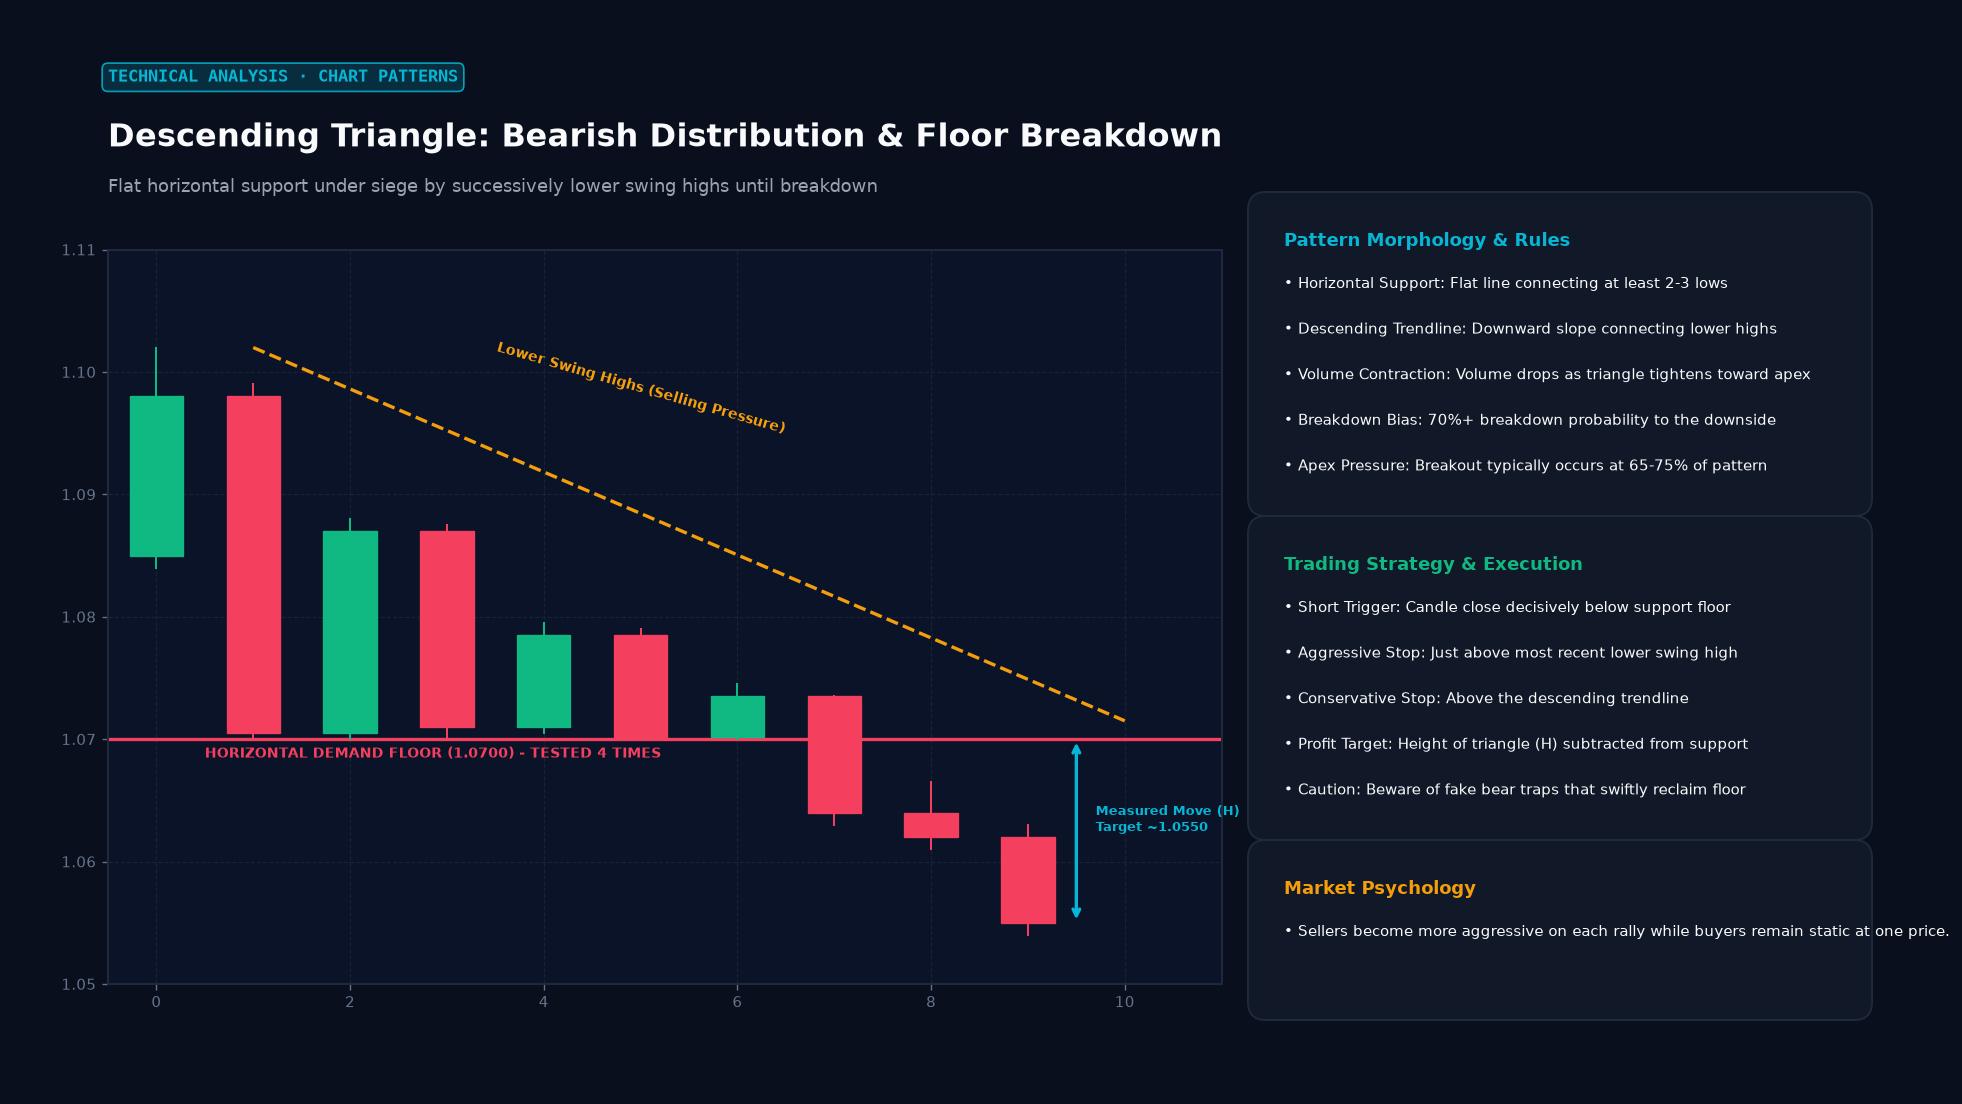 Figure: Flat horizontal support under siege by successively lower swing highs until breakdown
- Prior Trend: While descending triangles can occasionally form as reversal patterns at the climax of an exhausted bull market, they are most reliable when they appear as continuation patterns within an established downtrend.
- Horizontal Support Line: Must connect at least two (ideally three or more) distinct reaction troughs at virtually the same price level.
- Descending Resistance Line: Must connect at least two consecutive, clearly defined lower reaction highs, sloping downward from left to right.
- Volume Contraction: During the formation of the triangle, trading volume (or tick volume in forex) should steadily contract. This drying up of volume reflects market coil and indecision as participants await a directional resolution.
- The Apex and Timing: The pattern typically resolves with a breakdown between 60% and 75% of the distance from the base to the apex. If price meanders all the way into the apex without breaking out, the pattern loses its kinetic energy and frequently degenerates into messy sideways chop.
Why the Support Level Collapses
The market microstructure behind a descending triangle breakdown is grounded in order book dynamics:
Every time price bounces off the horizontal support floor, passive Buy Limit orders resting at that price level are filled and consumed. Meanwhile, the rallies off the floor become shallower and shorter in duration, revealing that fewer buyers are willing to commit capital at higher levels.
Beneath the horizontal support line sits a massive, concentrated pool of protective Sell Stop orders placed by traders holding long positions, alongside Sell Stop breakout orders placed by momentum bears.
When aggressive sellers finally push price through the exhausted support line, all those resting stop-loss orders are triggered simultaneously, transforming instantly into aggressive market sell orders. This sudden cascade of automated selling creates an avalanche of supply, driving price downward with violent momentum.
Measuring the Price Target: The Measured Move
Technical analysts calculate the minimum expected profit target of a descending triangle using the measured move technique:
- Measure Pattern Height: Calculate the vertical distance between the highest point of the pattern (the first peak) and the horizontal support floor: $$ \text{Pattern Height} = \text{Initial Peak Price} - \text{Support Floor Price} $$
- Project Downward: Subtract the calculated height from the horizontal support level at the point of the breakout: $$ \text{Target Price} = \text{Support Floor Price} - \text{Pattern Height} $$
This measured objective represents the minimum structural expansion expected from the release of coiled volatility.
Practical Trading Strategies
Traders execute descending triangle setups through two standard methodologies:
Strategy 1: The Direct Breakout Entry (Aggressive)
- Entry: Enter a short position immediately upon the close of the first candle that closes decisively below the horizontal support line on your chosen timeframe (e.g., the 4-Hour chart).
- Advantage: Guarantees you do not miss fast-moving, runaway breakdowns.
- Risk: Higher vulnerability to false breakdowns (“bear traps”).
Strategy 2: The Retest Entry (Conservative)
- Entry: After price breaks below support, wait patiently for a corrective pullback to retest the broken support level from below. Under the principle of role reversal, the broken support floor now functions as new dynamic resistance. If price tests the line and prints a bearish rejection candlestick (such as a shooting star or pin bar), enter short.
- Advantage: Provides superior risk-reward and confirmation that former support is holding as resistance.
- Risk: In powerful institutional breakdowns, price may plunge straight toward the target without offering a pullback, leaving the conservative trader behind.
Stop-Loss Placement
For both strategies, the stop-loss order should be positioned safely above the most recent lower high formed inside the triangle prior to the breakdown. If price climbs back above that level, the structural integrity of the bearish pattern is completely invalidated.
Practical Forex Example: 4-Hour AUD/USD Breakdown
Consider a swing trader monitoring the 4-Hour chart of AUD/USD:
- Context: AUD/USD is in an existing downtrend. Price hits 0.6600 and establishes a horizontal support floor, bouncing from 0.6600 three separate times over three weeks.
- Forming Lower Highs: The peaks of each bounce drop steadily: Peak 1 reaches 0.6720, Peak 2 reaches 0.6680, and Peak 3 reaches 0.6645, creating a textbook descending triangle.
- Pattern Height: $$ \text{Height} = 0.6720 - 0.6600 = 0.0120 \text{ (120 pips)} $$
- The Breakdown: A bearish 4-Hour candle breaks cleanly through the floor, closing at 0.6580.
- Trade Execution: The trader enters short on the retest of the broken floor at 0.6595.
- Stop-Loss: Placed 20 pips above Peak 3 at 0.6665 (70 pips risk).
- Target: The measured move projects 120 pips below the 0.6600 breakdown level: $$ \text{Target} = 0.6600 - 0.0120 = 0.6480 \text{ (+115 pips)} $$
- Result: Over the following five days, selling momentum carries AUD/USD steadily lower to 0.6480, hitting the profit target and delivering a 1.6:1 reward-to-risk return.
Key Takeaways
- A descending triangle features a flat horizontal support line and a downward-sloping resistance line of lower highs.
- It is primarily a bearish continuation pattern that signals seller dominance and impending downside breakout.
- Volume typically contracts during pattern development and expands sharply upon the breakdown.
- The profit target is projected downward by subtracting the maximum height of the triangle from the horizontal breakout level.
- Traders enter either on the initial breakout candle close or on the subsequent retest of broken support as new resistance.
FAQ
Can a descending triangle break to the upside? Yes. While roughly 70% of descending triangles break downward as expected, roughly 30% break to the upside, particularly when they form during strong macroeconomic bull markets. Always wait for a confirmed price break outside the pattern boundaries rather than anticipating the direction in advance.
What is the difference between a descending triangle and a falling wedge? In a descending triangle, the bottom boundary is completely flat and horizontal. In a falling wedge, both the upper and lower trend lines slope downward and converge. While descending triangles are bearish continuation patterns, falling wedges are almost universally bullish reversal patterns.
How do I avoid false breakdowns? Require a complete candlestick close outside the pattern on a significant timeframe (such as the 4-Hour or Daily chart) before executing. Avoid trading intraday wick penetrations, and look for tick volume expansion to confirm genuine institutional participation.
Ready to trade forex?
Open a free demo account with a regulated broker. Practice with virtual funds before risking real money.