Wedge
A wedge is a chart pattern formed by two converging trend lines that slope in the same direction — both upward (rising wedge) or both downward (falling wedge). Unlike channels where the lines are parallel, wedge lines converge toward a point (apex). Rising wedges are typically bearish reversal patterns; falling wedges are typically bullish reversal patterns. They signal a compression of price movement that typically resolves with a breakout.
The Contrarian Nature of Wedges
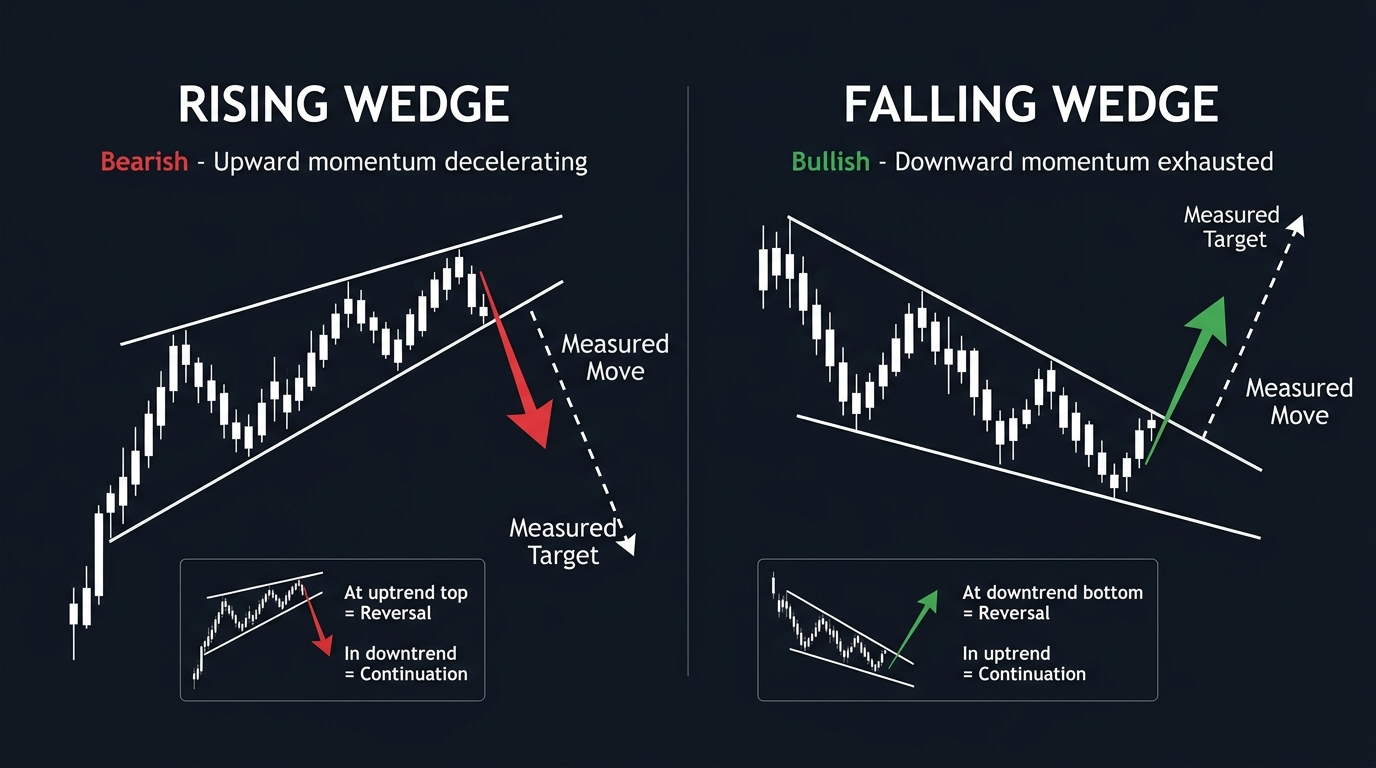
Wedges are counterintuitive to traders who haven’t studied them carefully. A rising wedge — where price is making higher highs and higher lows, trending upward — is actually a bearish pattern. Why? Because the highs and lows are converging. Each new high is not as high as it “should” be relative to the prior high; each pullback recovers less ground. The upward momentum is decelerating even as price technically continues higher.
This deceleration is the warning sign. The market is running out of buying energy within the wedge, and when it eventually breaks below the lower support line, the move often carries significant downward momentum.
The same logic applies in reverse to falling wedges.
Rising Wedge: Bearish Signal
Formation: Both the upper resistance line and the lower support line slope upward, but the upper line has a shallower slope — the lines are converging. The range between highs and lows is narrowing as the pattern develops.
Where it appears:
- At the top of an uptrend: A reversal signal — the uptrend is losing momentum and a significant decline follows
- During a downtrend (as a corrective move): A continuation signal — the counter-trend rally is losing momentum before the downtrend resumes
Breakout: Price breaks below the lower support line. The breakout is typically sharp and fast because traders who had been buying within the wedge are now trapped and rushing to exit simultaneously.
Target: Measured move = height of the wedge at its widest point (left side) projected downward from the breakout level.
Falling Wedge: Bullish Signal
Formation: Both lines slope downward, with the lower support line having a shallower slope — lines converge. Each lower high and lower low comes with decreasing downward momentum.
Where it appears:
- At the bottom of a downtrend: A reversal signal — selling pressure is exhausting
- During an uptrend (corrective move): A continuation signal — the counter-trend correction is losing bearish momentum before the uptrend resumes
Breakout: Price breaks above the upper resistance line, often decisively and with volume expansion.
Target: Height of the wedge at its widest point projected upward from the breakout.
Wedge vs. Triangle: A Key Distinction
Both wedges and triangles have converging lines, but the distinction matters:
Symmetric triangle: Upper line slopes downward; lower line slopes upward. Lines converge from both sides. Neutral pattern — can break either direction.
Ascending triangle: Flat upper line; rising lower line. Bullish bias — buyers are consistently willing to buy at higher prices.
Descending triangle: Flat lower line; declining upper line. Bearish bias.
Rising wedge: Both lines slope upward. Bearish bias — the upward move is losing momentum.
Falling wedge: Both lines slope downward. Bullish bias — the downward move is losing momentum.
The critical difference: in a triangle, one line is horizontal; in a wedge, both lines slope in the same direction.
Volume and Wedge Confirmation
In equity markets, volume analysis is an important part of wedge interpretation:
- Volume typically declines as the wedge develops (less conviction in the current direction)
- Volume expands significantly on the breakout, confirming the pattern resolution
In forex, tick volume serves as a proxy. The same expectations apply: declining tick activity within the wedge, expanding activity on the break.
If the breakout occurs on very low volume (tick count), it may be a false breakout — monitor for a quick reversal back into the wedge.
Common Mistakes
Entering inside the wedge: Wedge patterns are only confirmed on the breakout. Trading inside the pattern means taking a position before the signal has materialized.
Confusing a steep channel with a wedge: In a channel, the lines are parallel. In a wedge, they converge. If the lines aren’t converging, it’s not a wedge.
Setting the target too aggressively: The measured move is the maximum implied target, not a guaranteed destination. Many traders take partial profits at 50% of the measured move.
Key Takeaways
- Rising wedge: both lines slope up, converging — bearish signal (uptrend losing momentum)
- Falling wedge: both lines slope down, converging — bullish signal (downtrend losing momentum)
- Wedges differ from triangles: in wedges, both lines slope the same direction; in triangles, they don’t
- Breakout target = widest point of the wedge projected from the breakout level
- Volume should decline within the wedge and expand on the breakout
FAQ
Are rising wedges always bearish? Mostly, but context matters. A rising wedge in a correction during a strong downtrend is a bearish continuation pattern. A rising wedge at the very top of a multi-year uptrend is a major reversal signal. The same pattern can be continuation or reversal depending on where in the broader trend it appears.
How far should the wedge be into its formation before trading the breakout? A wedge should be at least 60-70% complete (price should have traveled at least 60% toward the apex). Too early, and the lines aren’t meaningfully converging yet. Trading exactly at the apex is risky because breakouts at the very tip are sometimes whipsaws.
Ready to trade forex?
Open a free demo account with a regulated broker. Practice with virtual funds before risking real money.