Double Top and Bottom
Double top and double bottom are reversal chart patterns formed when price tests a significant level twice and fails to break through, signaling that the dominant trend is losing momentum. The double top (two peaks at roughly the same level) is a bearish reversal signal; the double bottom (two troughs at the same level) is a bullish reversal signal. Both are among the most reliable and widely traded reversal patterns.
Why Two Failures Matter More Than One
Markets test levels. A currency pair approaching a major resistance level will often probe it — sometimes breaking through, sometimes retreating. A single failure at resistance doesn’t constitute a signal; it might be a temporary pause before a breakout.
Two failures at the same level tell a more significant story. The first failure shows that sellers were active at that price. The interim rally that follows tests whether the sellers remain engaged. When price returns to the same level and fails again — often at lower momentum than the first attempt — it confirms that supply at that specific price is persistent and sufficient to overpower demand. That’s the logic behind the double top.
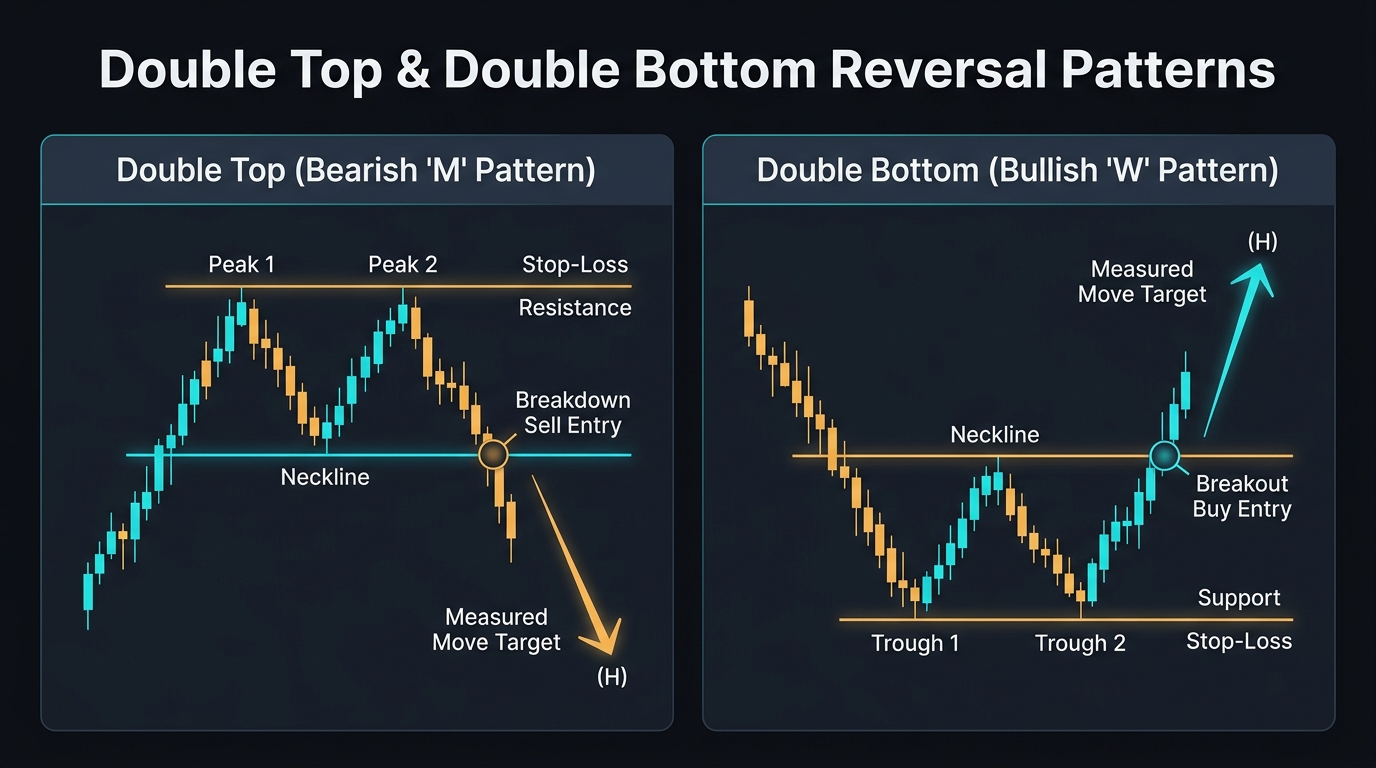
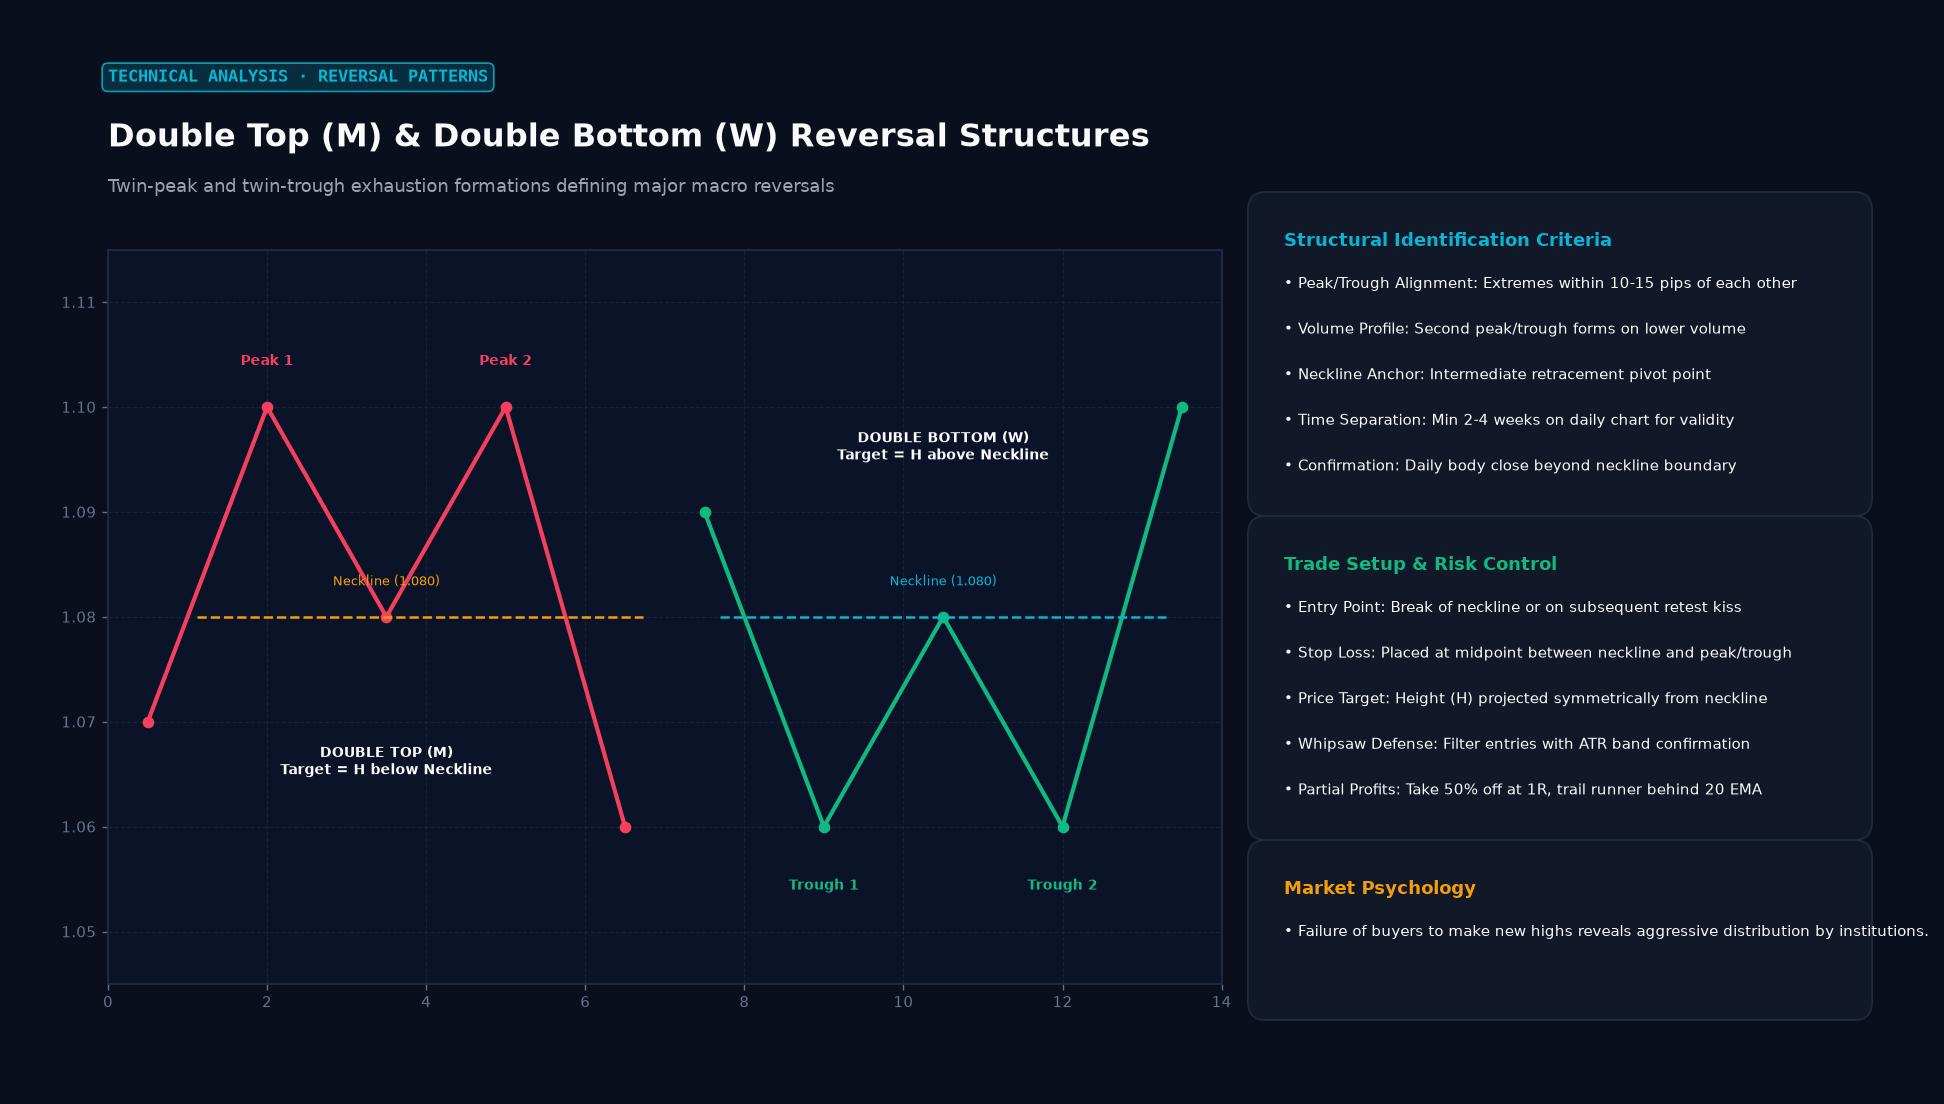 Figure: Twin-peak and twin-trough exhaustion formations defining major macro reversals
Double Top: The Bearish Reversal
Formation: Price rallies to a new high (Peak 1), pulls back to an intermediate support level (the “neckline”), then rallies again to approximately the same high (Peak 2), and fails. The two peaks are roughly equal in height, though perfect symmetry isn’t required — the second peak can be slightly higher or lower.
Volume signature: Ideally, volume on the second peak rally is lower than on the first peak rally. This lower volume on the approach to the same high level is evidence that fewer buyers are participating — the conviction behind the upward move is weakening.
Trigger: The pattern is confirmed when price breaks below the neckline (the intermediate support between the two peaks). Not before. Selling before neckline confirmation is entering a trade that doesn’t yet exist.
Price target: Measure the distance from the neckline to the peak. Project that same distance downward from the neckline. This is the measured move target. If the neckline is at 1.0900 and the peaks are at 1.1100 (200 pips above), the target after the neckline break is 1.0700.
Double Bottom: The Bullish Reversal
The mirror image. Price falls to a new low (Trough 1), bounces to an intermediate resistance level (neckline), then falls again to approximately the same low (Trough 2), and holds. The failure to reach new lows confirms that sellers are exhausted at this price level.
Confirmation: Neckline break to the upside. Price must close convincingly above the resistance level between the two troughs.
Target: Distance from neckline to troughs, projected upward from the neckline.
The “W” shape: Double bottoms often resemble the letter W on the chart — two dips separated by a bounce — which is sometimes used as an alternative name.
Distinguishing Real Patterns from Noise
Not every two-peak formation is a valid double top. Quality criteria:
Time between peaks: Peaks that are very close together in time (1-2 bars) are better described as a failed breakout than a double top. The two peaks should have meaningful separation — enough time for a genuine rally and pullback cycle to complete.
Equal height: The more similar the two peaks in height, the more reliable the pattern. A second peak more than 3-5% above the first (on a major pair) is typically not considered a double top — it’s a new high that happened to fail.
Neckline clarity: The neckline should be identifiable as a level with at least one prior touch as support/resistance. A neckline that’s arbitrary creates an ambiguous pattern.
Volume confirmation: On daily charts, increasing volume on the neckline break significantly increases pattern reliability.
Double Top vs. Head and Shoulders
Both are reversal patterns; both feature a neckline trigger. The distinction: the Head and Shoulders has three peaks with the middle highest (the “head”), making it more definitive as a top. The double top has two roughly equal peaks.
In practice, the patterns are sometimes interchangeable in interpretation — a failed Head and Shoulders that forms only a left shoulder and head before reversing at a lower right shoulder level can resemble a double top from certain vantage points. The important thing is the neckline break, not the exact pattern label.
Key Takeaways
- Double top: two peaks at equal heights, bearish — confirmed by a break below the neckline
- Double bottom: two troughs at equal depths, bullish — confirmed by a break above the neckline
- Price target = height of the pattern (peak to neckline), projected from the neckline break
- Lower volume on the second peak/trough strengthens the pattern’s reliability
- Never trade the pattern before neckline confirmation — premature entries have high failure rates
FAQ
What if the second peak slightly exceeds the first? A second peak up to 3-5% above the first is still generally considered a potential double top if it shows similar rejection (long upper wick, bearish candlestick). If the second peak exceeds the first by more, it’s more accurately described as a breakout that failed rather than a double top.
How reliable are double tops and bottoms? Thomas Bulkowski’s research in Encyclopedia of Chart Patterns found double tops have roughly a 65-70% success rate after confirmation (neckline break). The key qualifier is “after confirmation” — patterns that haven’t confirmed yet have lower reliability because many potential double tops resolve as breakouts instead.
Ready to trade forex?
Open a free demo account with a regulated broker. Practice with virtual funds before risking real money.