Durable Goods Orders
Durable Goods Orders is a key macroeconomic indicator published monthly by the US Census Bureau, measuring the dollar value of new purchase orders placed with domestic manufacturers for products with an expected lifespan of three years or more. It serves as a leading indicator of industrial health and business investment.
What Are Durable Goods Orders?
In macroeconomic analysis, Durable Goods Orders (formally designated as the Manufacturers’ Shipments, Inventories, and Orders report) is an influential economic data release published monthly by the United States Census Bureau.
The report tracks the total nominal dollar value of new contracts and purchase orders placed by businesses, government agencies, and consumers with domestic manufacturers for durable goods—defined by government statisticians as physical, heavy manufactured products with an anticipated operating lifespan of three years or longer.
Common examples of durable goods include:
- Commercial and Defense Aircraft: Passenger airliners, military jets, and helicopters.
- Transportation Equipment: Commercial trucks, passenger automobiles, locomotives, and maritime vessels.
- Heavy Industrial Machinery: Factory turbines, automated robotics, mining earthmovers, and construction equipment.
- Technology and Electronics: Enterprise computer servers, telecommunications hardware, and semiconductors.
- Consumer Appliances: Residential refrigerators, washing machines, and HVAC systems.
Because durable goods represent expensive, long-term capital investments, the report is scrutinized by economists, the Federal Reserve, and foreign exchange traders as a vital leading indicator of the business cycle.
Why Durable Goods Orders Are a Leading Economic Indicator
Economic indicators are generally classified into three timing categories: leading, coincident, and lagging. While metrics like Gross Domestic Product (GDP) and the Unemployment Rate are coincident or lagging indicators that describe what has already happened, Durable Goods Orders is a forward-looking leading indicator.
Corporations and consumers do not purchase multi-million-dollar manufacturing assembly lines, corporate aircraft, or fleet trucks casually. A decision to place a firm purchase order signals that corporate executives are confident in future consumer demand, expected profitability, and economic expansion.
Furthermore, manufacturing durable goods requires lengthy production lead times—often taking six to eighteen months from the initial contract signing to final factory assembly, shipment, and billing. Therefore, an influx of new durable orders today guarantees that factories will run at high capacity, purchase raw materials (steel, copper, microchips), and maintain or expand worker payrolls well into the future, providing an advance preview of upcoming quarterly GDP growth.
Conversely, when corporate confidence wanes, expensive capital expenditure projects are the very first budget items to be frozen or canceled, making durable goods orders one of the earliest canaries in the coal mine signaling an impending economic slowdown or recession.
Decoding the Report: Headline vs. Core Capital Goods
The headline durable goods figure reported by mainstream financial media can be notoriously noisy and misleading. To analyze the report effectively, currency traders dissect three distinct data tiers:
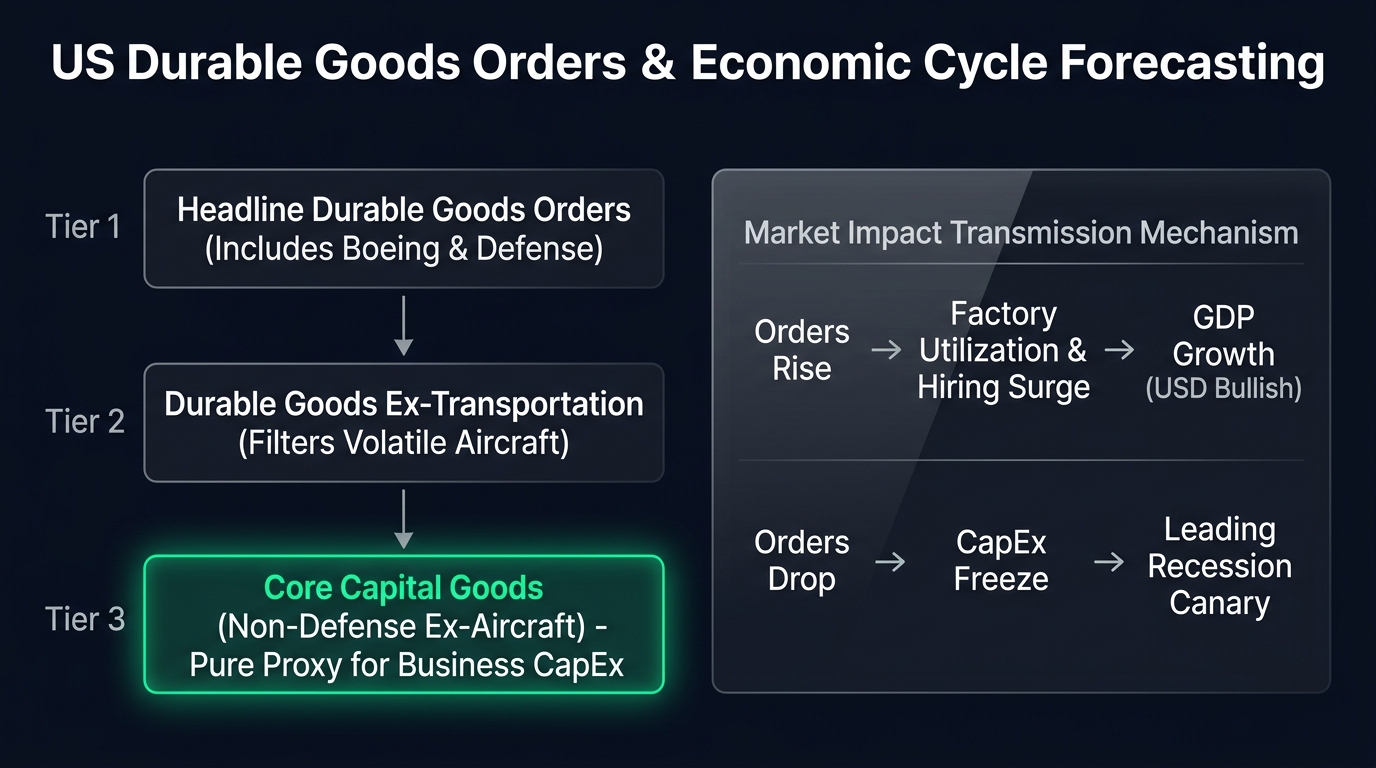
┌────────────────────────────────────────────────────────┐
│ 1. Headline Durable Goods Orders                       │
│    Includes all sectors, but distorted by aircraft     │
└──────────────────────────┬─────────────────────────────┘
                           ▼
┌────────────────────────────────────────────────────────┐
│ 2. Durable Goods Excluding Transportation              │
│    Strips out volatile commercial airplanes and cars   │
└──────────────────────────┬─────────────────────────────┘
                           ▼
┌────────────────────────────────────────────────────────┐
│ 3. Core Capital Goods (Non-Defense Ex-Aircraft)        │
│    THE KEY METRIC: Pure proxy for business CapEx       │
└────────────────────────────────────────────────────────┘
1. Headline Orders (Subject to Extreme Aircraft Distortion)
The headline figure includes all industrial categories, but it is heavily skewed by the commercial aerospace sector. A single multibillion-dollar fleet purchase of 100 passenger airliners by a foreign airline placed with Boeing can cause headline US durable goods orders to spike by +15% in one month, only to plummet by -10% the following month when no new aircraft contracts are signed. This extreme lumpy volatility obscures the underlying health of the broader economy.
2. Durable Goods Excluding Transportation
To eliminate the distortion caused by civilian aircraft, military aerospace, and automotive retooling, economists monitor the “Ex-Transportation” metric. This provides a significantly cleaner representation of broad industrial demand.
3. Core Capital Goods (Non-Defense Capital Goods Excluding Aircraft)
For macro traders and Federal Reserve policymakers, Non-Defense Capital Goods Excluding Aircraft is the single most critical figure in the entire release. Commonly referred to simply as Core Capital Goods or Core CapEx, this metric strips out both volatile commercial aircraft and government defense procurement.
Core Capital Goods measures pure, private-sector corporate investment in the physical capital required to operate businesses—machinery, computer networks, and industrial tools. It serves as the primary direct proxy for business capital expenditures (CapEx) in the national income accounts, directly feeding into the investment ($I$) component of the GDP calculation.
Market Impact: How the Report Moves the US Dollar
Durable goods data is released monthly around the 26th of each month at 08:30 Eastern Standard Time (EST), covering orders placed during the preceding month.
Foreign exchange market participants trade the release by comparing actual results against institutional consensus expectations:
The Bullish US Dollar Scenario (Better-Than-Expected Core Orders)
- Data Surprise: Core Capital Goods orders print significantly above consensus expectations (e.g., +1.2% actual vs. +0.2% expected).
- Macro Implication: American corporations are actively spending capital and expanding capacity. Economists immediately revise upward their tracking estimates for upcoming US GDP.
- Monetary Policy Reaction: A resilient, expanding economy reduces the likelihood of Federal Reserve interest rate cuts, or bolsters the case for hawkish monetary tightening.
- Forex Price Action: US Treasury bond yields rise, attracting foreign capital into US Dollar assets. The US Dollar appreciates across the board, driving USD/JPY higher and pushing EUR/USD lower.
The Bearish US Dollar Scenario (Worse-Than-Expected Core Orders)
- Data Surprise: Core Capital Goods contract unexpectedly (e.g., -0.8% actual vs. +0.3% expected).
- Macro Implication: Private businesses are pulling back on investment, hoarding cash, and anticipating a drop in consumer demand.
- Forex Price Action: Treasury yields decline as markets price in increased odds of Federal Reserve monetary easing. The US Dollar weakens against major peers.
Practical Trading Example: Trading the Core CapEx Beat
Consider a day trader preparing for the 08:30 EST US economic release:
- Context: Prior to the release, USD/JPY trades quietly around 154.20. S&P 500 futures are flat.
- The Consensus: Economists forecast Headline Durable Goods to rise +0.5%, with Core Capital Goods (Non-Defense Ex-Aircraft) expected at +0.1%.
- The Data Print at 08:30 EST:
- Headline Orders: +2.1% (boosted by airplane orders).
- Core Capital Goods: +1.4% (a massive positive beat, the highest reading in 14 months).
- Upward Revision: The prior month’s Core figure was also revised upward from +0.2% to +0.5%.
- Market Reaction: US 10-year Treasury yields jump 6 basis points within 60 seconds as traders recognize that corporate CapEx spending is accelerating.
- Trade Execution: The trader enters a long position on USD/JPY at 154.40 on the immediate 1-minute breakout candle.
- Stop-Loss: Placed 20 pips lower at 154.20 (just below pre-news consolidation).
- Outcome: Algorithmic buying sustains throughout the morning. USD/JPY advances 65 pips to reach intraday resistance at 155.05, where the trader takes profit for a +65 pip gain ($650 on 1 standard lot), risking only 20 pips.
Key Takeaways
- Durable Goods Orders measures new purchase orders placed with US manufacturers for items intended to last three years or longer.
- It functions as a premier leading economic indicator, previewing industrial capacity, employment, and future GDP trends.
- The headline figure is frequently distorted by multi-billion-dollar commercial aircraft orders.
- “Core Capital Goods” (Non-Defense Ex-Aircraft) is the essential metric, serving as the pure proxy for private business capital expenditures.
- Stronger-than-expected Core orders bolster US Treasury yields and drive US Dollar appreciation, while weak figures weigh on the currency.
FAQ
Why does the Census Bureau revise Durable Goods data so frequently? Durable goods data is released in two phases: an advance preliminary report (around the 26th of the month) based on early corporate survey returns, followed by a final factory orders report roughly a week later incorporating late corporate filings. Revisions between preliminary and final prints can be significant.
What is the difference between durable goods and non-durable goods? Durable goods have an expected operating life of three years or more (machinery, vehicles, electronics). Non-durable goods are consumed immediately or have a lifespan under three years (food, gasoline, clothing, pharmaceuticals).
How does Durable Goods Orders affect equity markets? A strong durable goods report is generally positive for industrial, manufacturing, and technology stocks because it confirms robust customer orders. However, if the economy is already overheating and fighting high inflation, an overly strong report can cause equities to sell off due to fears of aggressive Federal Reserve interest rate hikes.
Ready to trade forex?
Open a free demo account with a regulated broker. Practice with virtual funds before risking real money.