Retail Sales
Retail sales is an economic indicator that measures the total value of goods sold by retailers to consumers over a specific period. It is a key gauge of consumer spending strength — which accounts for roughly 70% of GDP in the US and similar proportions in other major economies. Strong retail sales indicate robust consumer demand, potentially inflationary, and supportive of interest rate expectations — generally bullish for the currency.
Why Retail Sales Move Currency Markets
Consumer spending is the engine of most developed economies. When people spend, businesses profit, hire more workers, pay higher wages, and prices rise. When spending contracts, the reverse unfolds — businesses cut costs, unemployment rises, deflationary pressure builds.
Central banks watch retail sales closely as a leading indicator of where inflation and growth are headed. Strong retail sales → inflationary pressure → rate hike expectations → currency strengthens. Weak retail sales → deflationary pressure → rate cut expectations → currency weakens.
In the United States, retail sales data is published monthly by the US Census Bureau and consistently ranks among the top-10 most market-moving scheduled releases for USD pairs. It’s released approximately 12-15 business days after the end of each reference month.
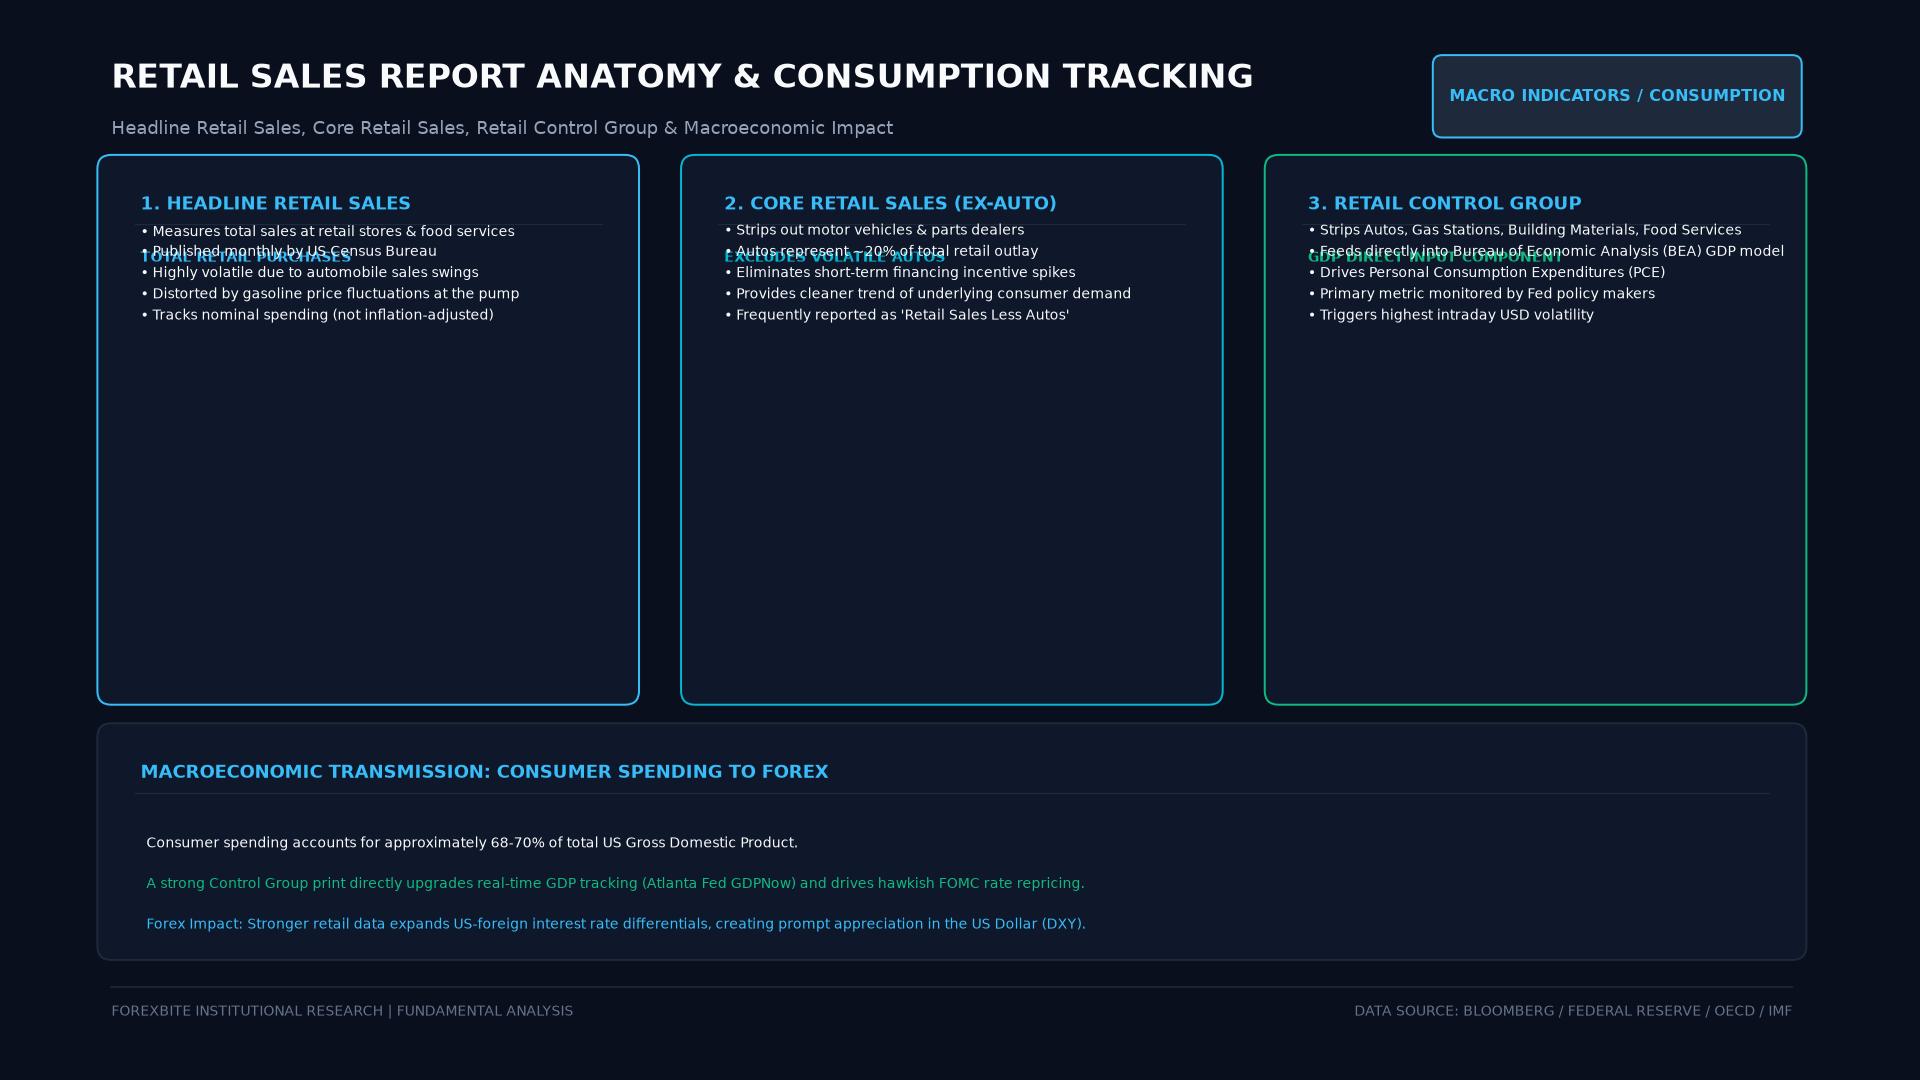 Figure: Decomposition of the monthly Retail Sales report into Headline Total Sales, Core Retail Sales (ex-autos), and the Retail Control Group that directly feeds into Bureau of Economic Analysis (BEA) GDP calculations.
What Retail Sales Measures (and Doesn’t)
The headline retail sales figure includes all goods sold at retail — clothing, electronics, groceries, automobiles, gasoline, furniture, restaurants. The US report covers approximately 5,500 retail establishments.
Core retail sales (ex-auto and ex-gas): Because automobile purchases are large, irregular, and heavily influenced by credit availability rather than everyday consumer sentiment, many economists prefer the “core” measure excluding autos. Excluding gasoline removes energy price volatility. The “control group” (excluding autos, gasoline, building materials, and food services) feeds most directly into GDP calculations.
What’s not included: Services spending (healthcare, education, financial services, utilities). Retail sales captures goods only. Because services dominate modern developed economies, retail sales is increasingly seen as an incomplete picture of total consumer activity.
Reading the Release
The key metric: actual vs. consensus (market expectation).
Better than expected (e.g., +0.7% actual vs. +0.3% expected): Bullish for USD. Markets price in higher growth and potentially higher rates.
In-line with expectations: Muted reaction — already priced in.
Worse than expected (e.g., -0.2% actual vs. +0.4% expected): Bearish for USD. Raises concerns about consumer weakness, potentially reducing rate hike expectations or accelerating cut expectations.
Revisions matter: The prior month’s figure is revised in every new retail sales report. A downward revision to the prior month, combined with a modest headline beat for the current month, is less bullish than it appears at face value.
Retail Sales Across Major Economies
US (Census Bureau): Monthly, mid-month release. Highest impact for USD pairs.
UK (ONS): Monthly, released approximately four weeks after month-end. Major GBP mover — UK consumer spending patterns are closely tied to BoE rate decisions.
Eurozone (Eurostat): Monthly, released later than individual country data. Germany and France release separately with shorter lags.
Australia (ABS): Monthly. Significant for AUD — Australia’s retail data influences RBA expectations directly.
Canada (Statistics Canada): Monthly. CAD pairs respond to Canadian retail data, though oil prices often dominate CAD movements.
Retail Sales and Trading Strategy
When retail sales significantly beats or misses expectations:
Immediate reaction (0-30 minutes): Currency reacts to the headline number. This window is high-volatility and wide-spread — the worst time to enter new positions.
Post-release analysis (30-60 minutes): After the initial move, price often consolidates or partially retraces as traders digest the full report (including revisions and breakdown categories). The more measured reaction after this period is typically more sustainable.
Trend alignment: The highest-probability trades combine a retail sales surprise with the existing fundamental trend. A strong retail sales beat that confirms an already-hawkish Fed narrative is more powerful than one that contradicts it.
Key Takeaways
- Retail sales measures consumer goods spending — a leading indicator of growth, inflation, and central bank policy direction
- Core retail sales (ex-auto, ex-gas) is the cleaner measure; the “control group” feeds directly into GDP
- Services spending is not included — retail sales captures only goods
- Strong beat = currency bullish; significant miss = currency bearish — always relative to consensus
- Don’t trade the first 30 minutes of the release — wait for the price to settle after the initial volatility
FAQ
How does retail sales compare in importance to NFP and CPI? In the US, NFP and CPI typically rank higher in market impact than retail sales, because they more directly inform Federal Reserve decisions. However, retail sales can be highly market-moving when it significantly surprises consensus — particularly if it confirms or challenges the existing narrative about consumer health.
Can retail sales predict recessions? Yes, partially. Sustained negative or flat retail sales over multiple consecutive months, combined with other deteriorating indicators (rising jobless claims, falling PMI), is a reliable recession signal. Retail sales has turned negative before every US recession in recent decades — though the lag varies.
Ready to trade forex?
Open a free demo account with a regulated broker. Practice with virtual funds before risking real money.