Ichimoku Cloud (Ichimoku Kinko Hyo)
Ichimoku Kinko Hyo — meaning 'one glance equilibrium chart' in Japanese — is a comprehensive technical analysis indicator that displays trend direction, momentum, support/resistance, and potential price targets simultaneously. Developed by journalist Goichi Hosoda in the late 1930s and published in 1969, it consists of five lines and the 'cloud' (Kumo) between two of them, giving traders a complete picture of market structure at a glance.
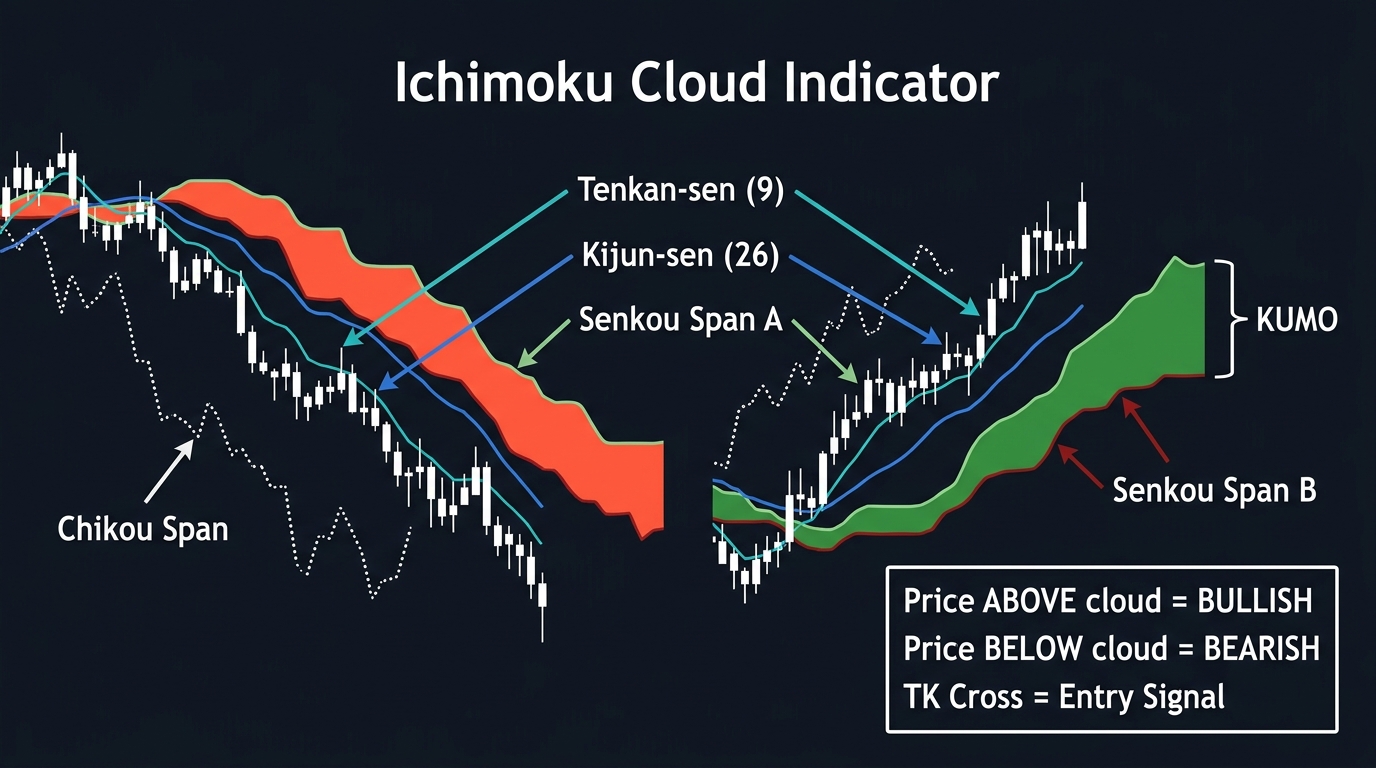
The Five Components of Ichimoku
Unlike most indicators that add one or two lines to a chart, Ichimoku layers five distinct calculations — each measuring a different aspect of price behavior. Understanding each component is essential before the system makes intuitive sense.
1. Tenkan-sen (Conversion Line) — (9-period)
The midpoint of the highest high and lowest low over the past 9 periods:
(9-period High + 9-period Low) / 2
This is not an average of closing prices — it’s the midpoint of the price range. It reacts quickly to price changes and acts as a near-term support/resistance and momentum indicator. A rising Tenkan-sen indicates short-term bullish momentum.
2. Kijun-sen (Base Line) — (26-period)
Same calculation but over 26 periods:
(26-period High + 26-period Low) / 2
The Kijun-sen is slower and acts as a medium-term trend indicator. When the Tenkan crosses above the Kijun, it generates a bullish signal (TK Cross). Below: bearish signal.
3. Senkou Span A (Leading Span A) — plotted 26 periods ahead
(Tenkan-sen + Kijun-sen) / 2, shifted 26 periods into the future.
4. Senkou Span B (Leading Span B) — plotted 26 periods ahead
(52-period High + 52-period Low) / 2, shifted 26 periods into the future.
The area between Senkou Span A and B is the Kumo (Cloud). When Span A is above Span B, the cloud is green (bullish). When Span A is below Span B, the cloud is red (bearish).
5. Chikou Span (Lagging Span) The current closing price plotted 26 periods into the past. Used to compare today’s price to where price was 26 periods ago — confirming the trend direction.
The Kumo: The Cloud and Its Role
The Kumo is the visual centerpiece of Ichimoku. It serves as dynamic support and resistance — not a single price level but a zone of contested territory:
- Price above the cloud: Bullish — the trend is up
- Price below the cloud: Bearish — the trend is down
- Price inside the cloud: Neutral/choppy — wait for a clear resolution
The cloud’s thickness also matters. A thick cloud is stronger support or resistance (harder to break through). A thin cloud is weaker and more likely to break on first contact. Traders watch for price to exit the cloud on one side as confirmation of a new trend direction.
The TK Cross: Primary Signal
The most widely traded Ichimoku signal is the Tenkan/Kijun (TK) Cross:
- Tenkan crosses above Kijun: bullish
- Tenkan crosses below Kijun: bearish
Signal quality depends on where the cross occurs relative to the cloud:
- Above the cloud: Strongest bullish signal (all three components — Tenkan, Kijun, and cloud — align bullishly)
- Inside the cloud: Neutral — lower reliability
- Below the cloud: Weakest bullish signal (fighting the broader trend)
Senkou Span A/B Crossover: Long-Term Signal
When Senkou Span A crosses above Span B, the cloud turns green — a long-term bullish signal. When A crosses below B, the cloud turns red — long-term bearish. These crossovers represent significant trend changes and are the Ichimoku equivalent of the golden cross/death cross.
Because the cloud is plotted 26 periods forward, traders can see future cloud structure — which gives them advance warning of where key support/resistance levels will be.
Using Ichimoku Practically
Trend identification: Immediate — color and position of the cloud tells the trend at a glance.
Entry signal: TK cross above the cloud, with Chikou Span above price from 26 periods ago.
Support/resistance: Senkou Span A and B serve as the first and second support/resistance levels. Price pulling back to the cloud edge (especially after a strong breakout) is a high-probability continuation entry point.
Stop-loss placement: For long trades entered above the cloud, the stop typically goes below the Kijun-sen or below the near edge of the cloud.
Key Takeaways
- Ichimoku consists of 5 lines plus the Kumo (cloud): Tenkan, Kijun, Senkou Span A & B, and Chikou
- Price above the cloud = bullish; below = bearish; inside = neutral
- The TK Cross (Tenkan over/under Kijun) is the primary entry signal; quality depends on position relative to cloud
- The cloud’s future projection provides advance visibility of where support/resistance will be
- A thick cloud is stronger support/resistance than a thin cloud
FAQ
Should I change Ichimoku’s default settings? The traditional settings (9, 26, 52) were calibrated for Japan’s 6-day trading week. For the 5-day Western trading week, some traders adjust to (10, 30, 60) to maintain proportional relationships. However, the original settings remain the global standard and are the ones most institutional participants use as reference.
Is Ichimoku suitable for all timeframes? Yes, though it’s most commonly used on daily and 4-hour charts. On shorter timeframes (15M), the signals are noisier. On weekly charts, Ichimoku cloud support/resistance levels are major structural reference points that many professional traders incorporate into their frameworks.
Ready to trade forex?
Open a free demo account with a regulated broker. Practice with virtual funds before risking real money.