Triple Top
A triple top is a bearish reversal chart pattern formed when price tests the same resistance level three times and fails to break above it on all three attempts. It is an extended version of the double top, with the third failure confirming that sellers are firmly in control at that price level. The pattern completes — and generates a sell signal — when price breaks below the support level (neckline) connecting the two troughs between the three peaks.
Why Three Failures Are More Significant Than Two
Every time price tests a resistance level and fails, it adds evidence that sellers at that level outweigh buyers. One failure might be a coincidence. Two failures (double top) establish a pattern. Three failures (triple top) are a strong statement: the market has repeatedly tried and repeatedly been rejected at the same price. Each failed rally consumes buying energy while sellers consistently defend their level.
The triple top is relatively rare compared to double tops — markets often break through on the second or third test rather than failing three times. When it does form, however, the subsequent breakdown tends to be reliable and often carries significant momentum.
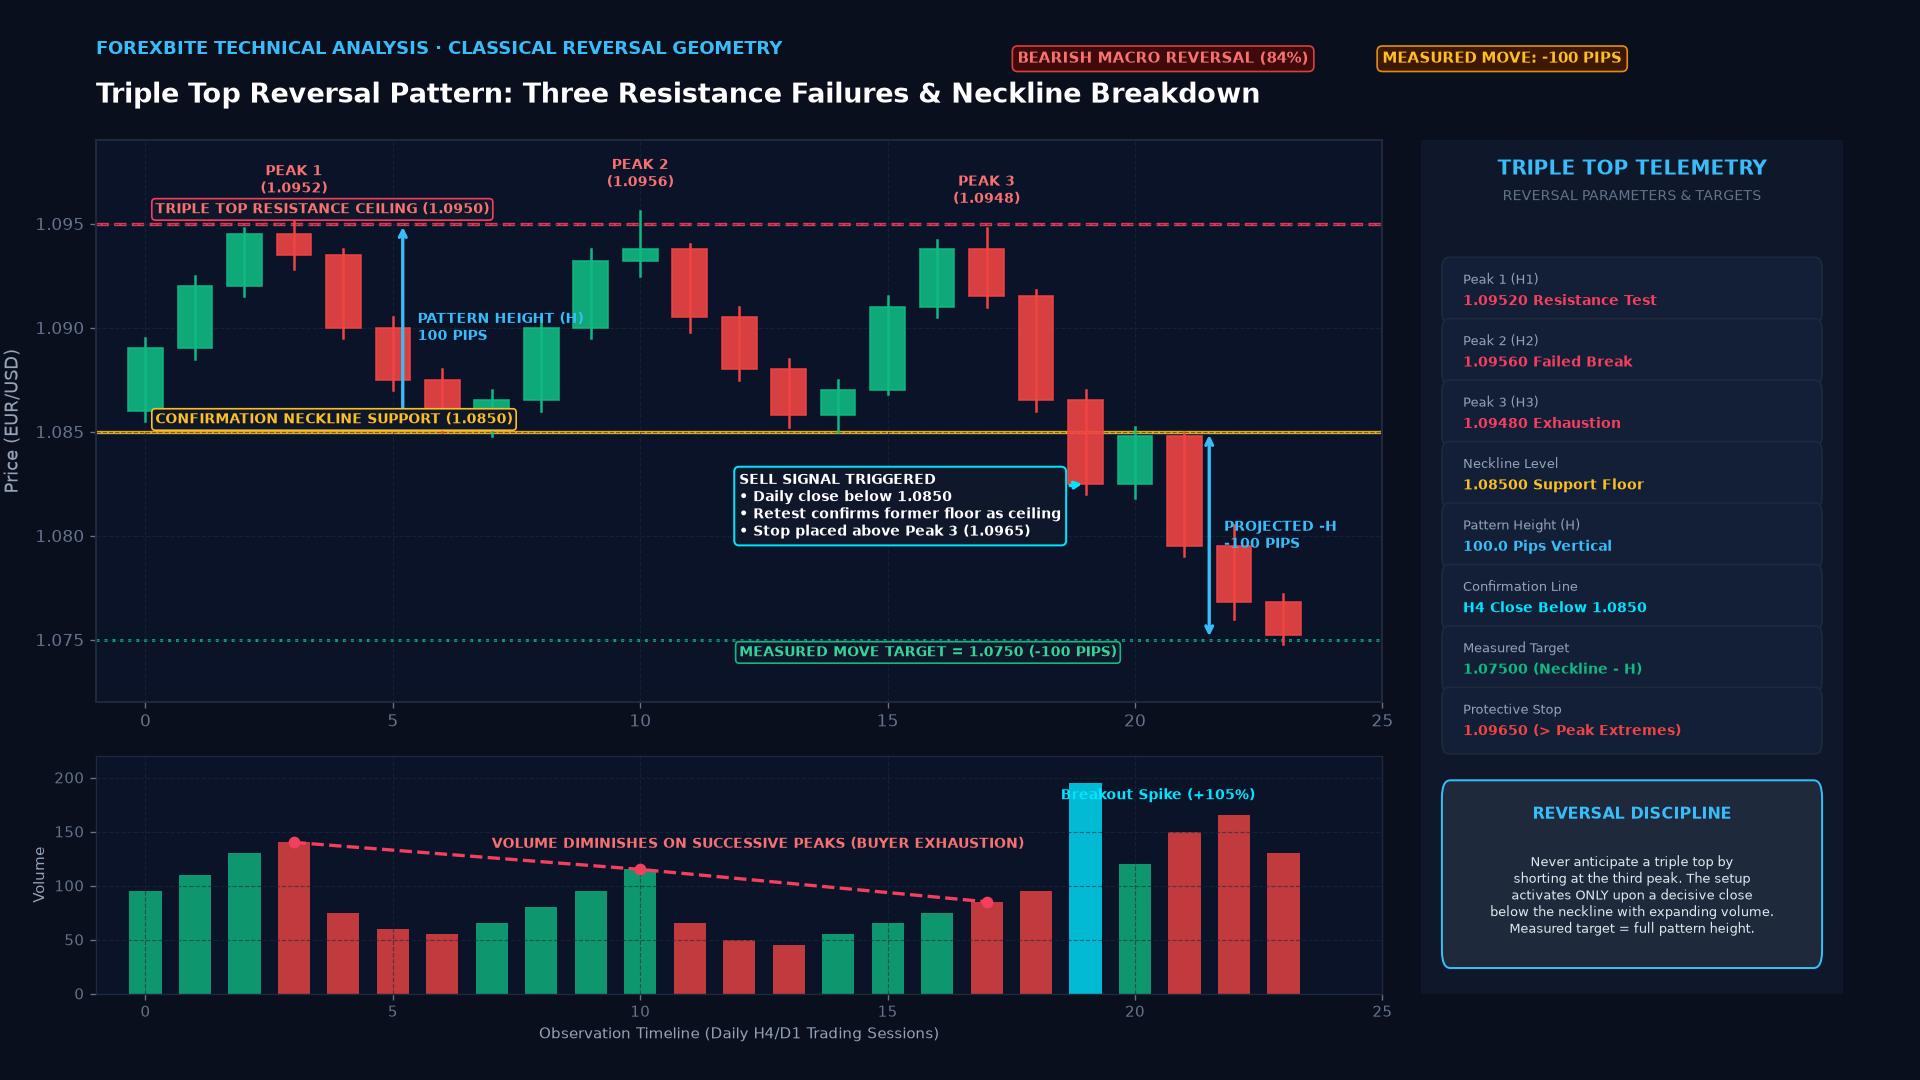
Pattern Structure
Three roughly equal peaks: Each peak tests approximately the same resistance level. The peaks don’t need to be identical — a variance of 0.5-1% is acceptable. The third peak should not significantly exceed the second (if it does, the pattern breaks down and price may be establishing a new high range).
Two troughs (neckline support): Between the three peaks, price pulls back to create two troughs. These troughs form the neckline support — a level that price must break below to confirm the pattern.
Volume pattern: In traditional chart analysis, volume typically decreases on each successive rally to the resistance level — buyers are becoming less committed with each attempt. Volume should expand on the neckline break, confirming the pattern completion.
Entry, Stop, and Target
Entry: When price closes below the neckline (the support connecting the two troughs). Not before — premature shorts have high failure rates because the pattern is not yet confirmed.
Stop-loss: Placed above the third peak (or the highest peak if they differ slightly). If price breaks above the resistance level after the pattern appeared to complete, the pattern is invalidated.
Target (measured move): The vertical distance from the neckline to the top of the peaks is projected downward from the neckline. If peaks are at 1.0950 and the neckline is at 1.0850 (100-pip pattern height), the target is 1.0750 (100 pips below the neckline).
Triple Top vs. Head and Shoulders
These patterns are sometimes confused. The distinction:
| Feature | Triple Top | Head and Shoulders |
|---|---|---|
| Peak heights | All three roughly equal | Middle peak (head) is highest |
| Pattern bias | More bearish certainty (three equal failures) | Asymmetric (lower right shoulder = weakening momentum) |
| Frequency | Less common | More common |
| Reliability | Generally high after confirmation | High after confirmation |
In practice, a trader might interpret what appears to be a “triple top forming” as a “head and shoulders still developing” if the third peak is notably lower than the second. The pattern labels matter less than the underlying principle: multiple failures at resistance with a neckline break confirming entry.
Real Market Example
EUR/USD in early 2023 tested the 1.0950-1.1000 resistance zone three times over several weeks — January, February, and early March — each time closing below the zone. When price broke below 1.0850 in March, trend-followers who had identified the triple top structure entered short positions targeting 1.0700. The move ultimately reached those levels over the following weeks.
Common Mistakes
Entering short on the third failure (without neckline break): The third touch at resistance might be the last test before a genuine breakout. Short entries before neckline confirmation are too early and have high failure rates.
Wide stops above all three peaks: If the peaks vary in height, the stop should go above the highest peak. But placing the stop excessively wide to accommodate all possible violations makes the risk-reward ratio too poor to justify the trade.
Key Takeaways
- Triple top: three failed tests of the same resistance level — bearish pattern
- Confirmed when price breaks below the neckline (support between the three peaks)
- Measured move target: pattern height projected downward from the neckline
- More reliable than double top due to additional confirmation of seller control at resistance
- Stop-loss goes above the highest of the three peaks
FAQ
What’s the equivalent bullish pattern? The triple bottom — three failed tests of the same support level, with a neckline resistance break above confirming the bullish reversal. It is the mirror image of the triple top in every respect.
Does a triple top guarantee a large decline? No pattern guarantees any specific outcome. The measured move is a statistical projection, not a certainty. Trade it with proper position sizing relative to your account — take partial profits at 50% of the measured move and trail the remainder, rather than holding to the full target.
Ready to trade forex?
Open a free demo account with a regulated broker. Practice with virtual funds before risking real money.